 What's new?

How to Increase Customer Loyalty by Using RFM Analysis?
Communication with customers is an extremely important task for every retailer. After all, every business exists and develops due to their purchases.
The effectiveness of such interaction will depend on how the right methods and approaches are chosen for each client. Therefore, no one can do it without competent segmentation of the entire client base. How to do that?
RFM analysisis a marketing approach for allocating all chain shoppers based on recency, frequency, and monetary. The resulting segments allow you to analyze the customer base, identify key buyers, and create the most effective strategy for interacting with each segment.
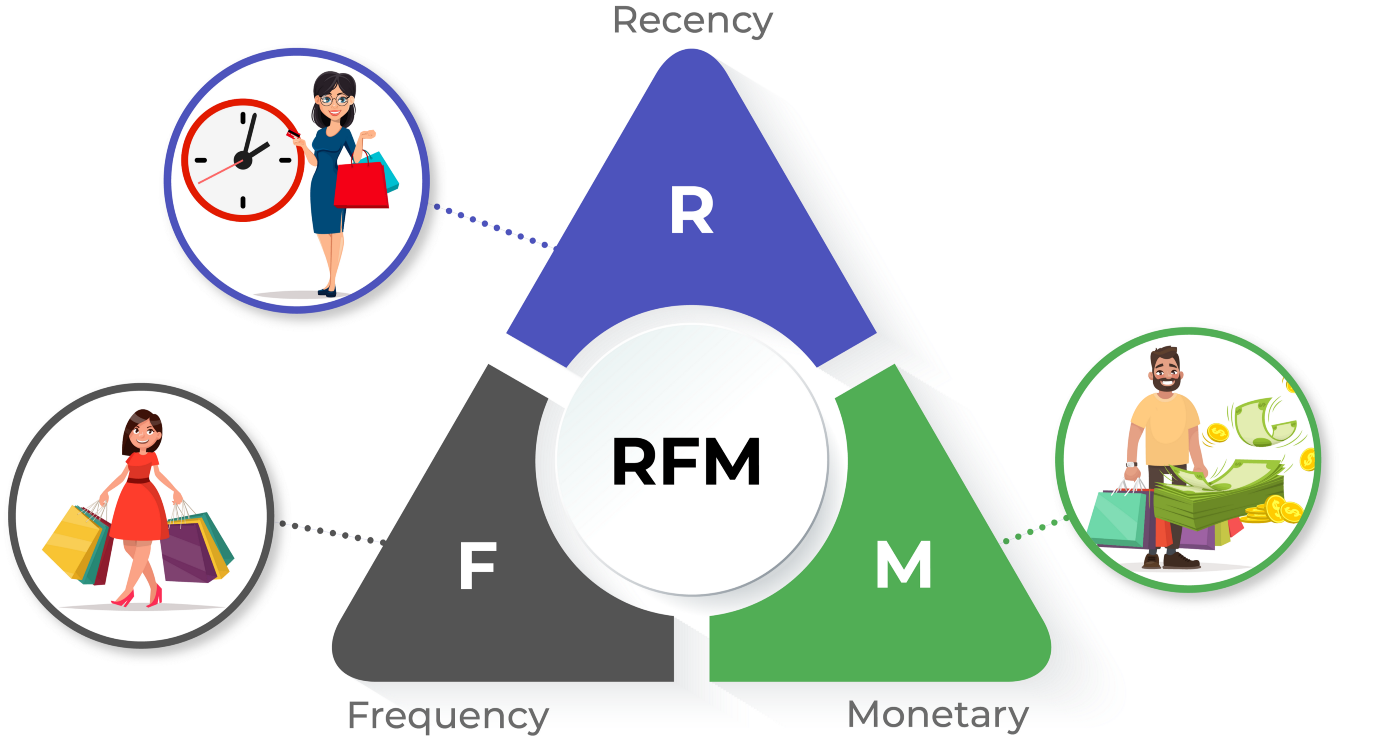
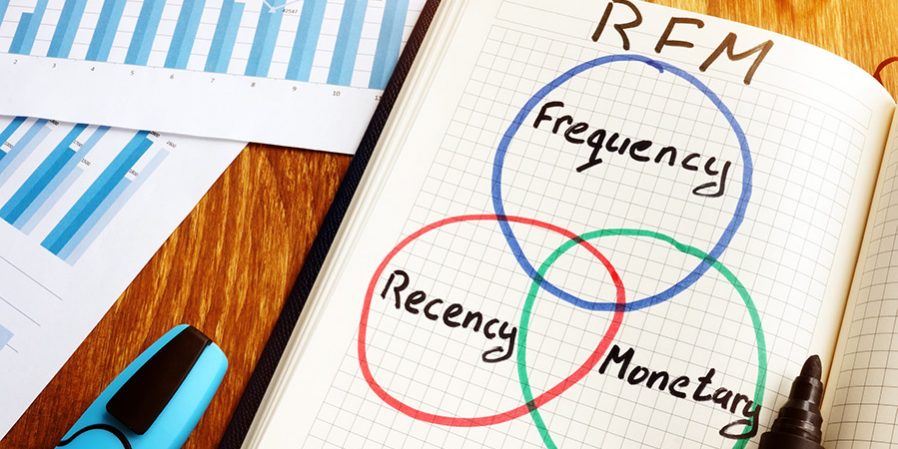
RFM is an abbreviation that explains the principle of customer segmentation and evaluation:
- Recency (R) - purchase recency - it shows how recently a customer purchased in your chain.
- Frequency (F) - frequency of purchases - it displays the total number of purchases for the selected period. I.e., how regularly a customer buys in the store.
- Monetary (M) - the value of a customer - it shows the total value of the customer's purchases or their average receipt.
What is the purpose of RFM analysis?
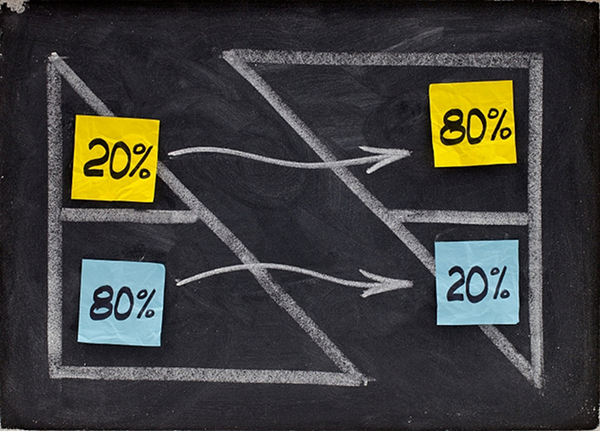
RFM analysis based on the Pareto law: "80% of the turnover is brought by 20% of regular customers, and the rest 80% of customers - only 20% of the turnover".
Therefore, each retailer needs to focus attention and efforts on this particular group (20% of customers).
You can easily identify such buyers using RFM segmentation. In addition, such an analysis of the client base will minimize marketing costs and get more profit.
Questions that can be answered while segmentation:
What customers generate the biggest revenue and are the most valuable to the chain?
What customers are on the edge of losing?
What customers respond best to advertising campaigns?
What marketing campaign will be the most effective for each segment?
What client can be retained and increase interest in shopping?
How to transfer customers from a "sleeping" group to "active buyers"?
! The main rule of RFM analysis:
We keep the best clients, we transfer the "medium" clients to the group of the best, and we return the "almost lost" ones.
The sequence of RFM analysis
Achieving the desired results of the analysis depends on its correct and accurate sequence. There are four steps to occur an RFM analysis.
Step 1. Information gathering
First, you need to collect the necessary data on chain customers for the select period (year, quarter, month):
- Name and surname (or card number) of the client;
- Phone number and email address for communication;
- Date of customer's purchases;
- The cost of purchases;
- Average receipt.
Such information is easily accessible if the loyalty program is properly organized and integrated with receipt data.

Step 2. Segmentation of the customer base
At this stage, all customers should be divided into groups according to recency, frequency, and monetary. Most often, for each criterion (R, F, M), 3 groups are created:
- Recency:
- 1 - clients purchased products recently;
- 2 - clients bought products not so far;
- 3 - clients purchased products a long time ago.
- Frequency:
- 1 - clients purchase rarely;
- 2 - clients purchase not often;
- 3 - clients purchase often.
- Monetary:
- 1 - the value of clients' purchases is high;
- 2 - the value of clients' purchases is medium;
- 3 - the value of clients' purchases is low.
Grouping can be done by expert evaluation or usingquantiles.
In the first case, the range for groups is determined by the analysts themselves.
In the second case, the distribution is carried out based on arithmetic calculations in the following form:
for Recency:
- (0 - 33%] - 1st group;
- (33.1 - 66%] - 2nd group;
- (66.1 -100%] - 3rd group.
for Frequency and Monetary:
- (0 - 33%] - 3rd group;
- (33.1 - 66%] - 2nd group;
- (66.1 -100%] - 1st group.
The values of 33% and 66% will depend on the values of the indicators (recency, frequency, turnover/average receipt) in the generated sample. In the future, these values will be the grouping limits for the three segments.
Each customer segment receives its three-digit number.
For example!The customer from group 333 is the least value for the chain since he purchased a small value of products one-time a long time ago.
A 111 customer is a strategic customer who frequently purchases high-value products.
As a result of RFM segmentation, a matrix of 27 groups (3 * 9) is formed.
Step 3. Analysis of customer segments and development of marketing campaigns
This is one of the most important steps in RFM analysis. After all, any analytical procedure or indicator calculation should be guided by further management decisions. In this case, it is the development of personal offers and strategic actions for increasing customer loyalty and product sales.
We have systematized the main management directions of action for each segment:
| Segment | Characteristic | Actions |
Regular customers | ||
111 | Strategically important clients | This 20% of buyers bring 80% of the chain profits. It is necessary to show them their importance: issue a personal "gold" card or assign a VIP status, express gratitude in a pleasant compliment or gift. Discounts and bonuses are not relevant for such customers. |
112 | Regular customers | These clients can be transferred to the VIP group (111) by offering special discounts, promotions, and bonuses. Now they regularly purchase online with an average receipt. |
113 | Loyal customers who spend a little | You need to accrue additional bonuses to your loyalty card, offer a gift for an extra purchase, or reach a certain amount of receipt. |
121 | Loyal customers who buy irregularly but spend a lot | It is necessary to study their purchases and offer novelties from a related category, and get feedback on what theyexpect from the chain. Such buyers should not be offered discounts. |
122-123 | Customers who purchase from time to time | Clients should be reminded about the chain with a certain regularity by sending out promotional offers and bonuses. |
131-133 | Beginners*
*we can't classify them correct | These beginners can become regular customers. You should actively interact with this group by providing useful information, and recommendations for choosing products. It is appropriate to invite them into social media groups, and offer promotions or a loyalty program. The goal of interaction with them is to build strong, mutually beneficial relationships. |
Sleeping customers | ||
211 - 213 | Sleeping regular customers | Such buyers still remember your chain, because they purchased not so far. You need to remind yourself by mailing promotions, bonus offers, and accrual of bonuses to the loyalty card. To find out the reason for stopping their purchases, you should send them a survey. |
221-223 | Sleeping rare customers | |
231-233 | Sleeping customers, who bought products once | You need to understand why customers don't shop as often as you want. To do this, send them a short survey to find out their needs and existing gaps in your chain. |
Lost customers | ||
311 | VIP customers who are leaving your chain | In the past, these are regular customers of the chain, and you should return them. The newsletter for them should include a survey, bonus, and promotional offers. |
312 | Valuable regular customers who are leaving the chain | |
313 | Regular customers with a minimum receipt who are leaving the chain | |
321-323 | Customers who rarely shop in the chain | These customers purchased several times and then stopped shopping in the chain. You should try to return them and understand why they don't buy products anymore. It is advisable to send an email with a survey. |
331-332 | One-time customers with a high and medium receipt | You need to get feedback to find out why they refused to buy products in your chain. You can offer them a profitable promotion. There is a high chance of returning such customers. |
333 | Lost customers | Highly probable, that these customers are lost to the chain. You can send an automatic mailing for reactivation. It is not recommended to insist and spend a lot of time/effort |
Step 4: Revising RFM segments after implementing marketing activities
It is important to review the RFM segments and their composition after mailing, promotions, and surveys. The frequency of RFM revising depends on the business dynamism. If your chain is large with high sales and a significant number of customers, then you need to update the RFM analysis data once a month. In other cases, you should do it rarer.
The main goal of the repeated RFM analysis is to understand what result was obtained from the activities carried out and how the composition of the segments has changed. And if the lost clients moved to another group, then you should stop sending them "resuscitation" emails.
Advantages and limitations of RFM analysis
In conclusion, let us consider the main advantages and limitations of using this analytical approach.
The main advantages of the approach:
- increasing customer loyalty;
- optimization of advertising costs due to its targeted direction;
- simplicity of implementation;
- easy integration with other customer interaction tools;
- possibility of use in small, medium, and large businesses;
- ability to profile each segment of the RFM analysis to more accurately understand the target audience.
Who is not suitable for RFM analysis:
- companies with a client base of fewer than 10,000 contacts;
- companies that focus on one-time sales.
To complete the described steps, we recommend using the "RFM analysis" report on the analytical platform for retailersDatawiz.io.
The functionality of the report not only quickly performs customer segmentation, but also helps you track the "migration" of customers from one group to another, analysis their shopping carts, and identify trends in sales indicators using dynamic visualizations.

 No credit card required