 What's new?
Descriptive Analytics for Retail Chains
Business growth through access to up-to-date analytics. Datawiz BI helps you see everything crucial in one place.
How does it work?
With Datawiz BI, you can identify the strengths and weaknesses of your operational and commercial activities. This knowledge helps identify problems on time and optimize processes, increasing efficiency at all stages.
Reports
Ready-made reports for quick access to critical information.
Artificial intelligence
Using machine learning algorithms to identify hidden opportunities.
Analytics
Adapting essential business metrics for your chain allows you to expand your analytics.

Price dynamics

Goods turnover

Work with suppliers

Sale of goods
Descriptive analytics provides a clear picture of what is happening in the business right now
Datawiz collects and analyzes data so that you can see all the important information in one place: from product sales and price dynamics to supplier operations and product turnover. This allows you to respond quickly to changes and make accurate decisions.
Interactive reports
These are just some of the available report categories - users can choose and customize even more to get the most useful information for business analysis. Try out the interactive reports in the demo to learn more about them, their features, and how they can help your business.30+ reports for retail
The service offers more than 30 reports for retail analysis, organized by category for easy use. This lets you quickly find the information you need and get the necessary indicators for decision-making. The main categories of reports include:
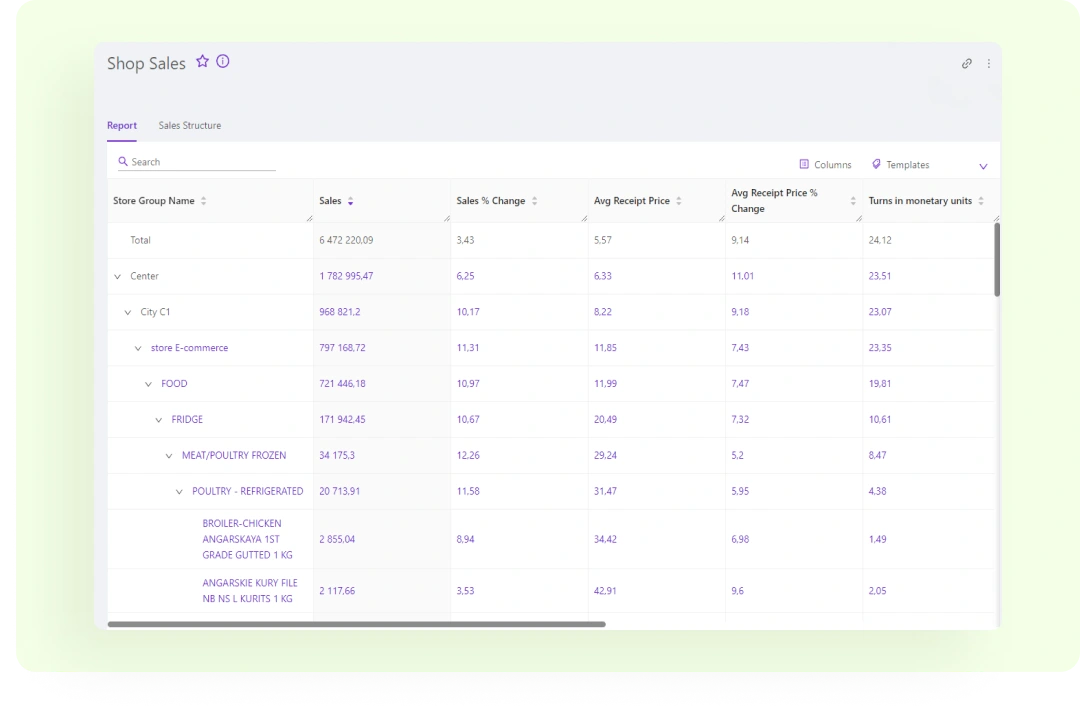
Sales
In this category, you will find reports that allow you to analyze sales by product, category, and store. For example, the Category Sales report will help you understand which categories generate the most revenue and how they change over time.
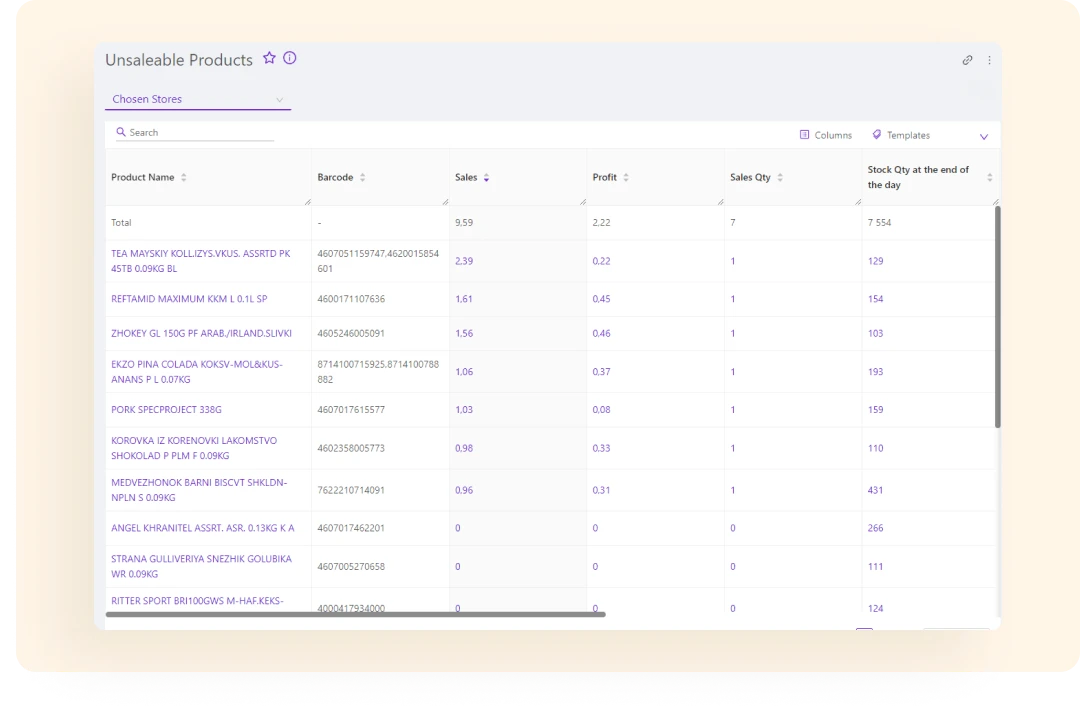
Assortment
This category of reports provides information about the performance of goods in your assortment. Identifying bestsellers and non-selling products will help you optimize your inventory, and the goods to withdraw report allows you to make informed decisions about products that need to be withdrawn from sale.
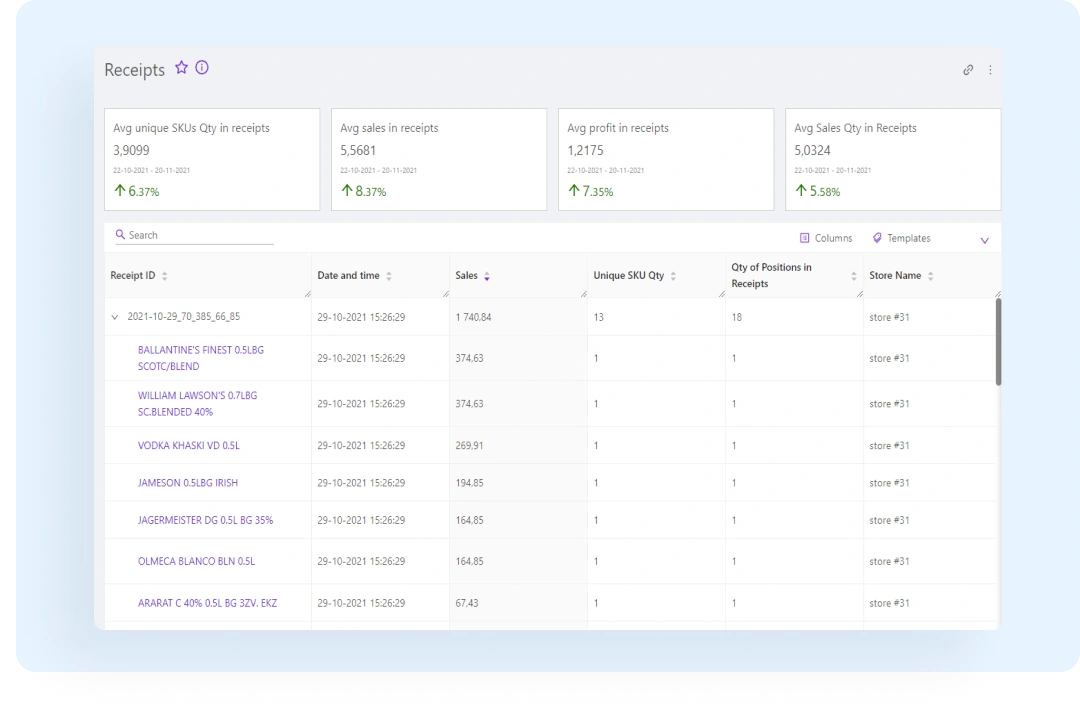
Loyalty program customers
Reports in this category allow you to evaluate customers' behavior in the loyalty program. The Receipts report can also analyze loyalty program customers, providing data on their activity and impact on sales.
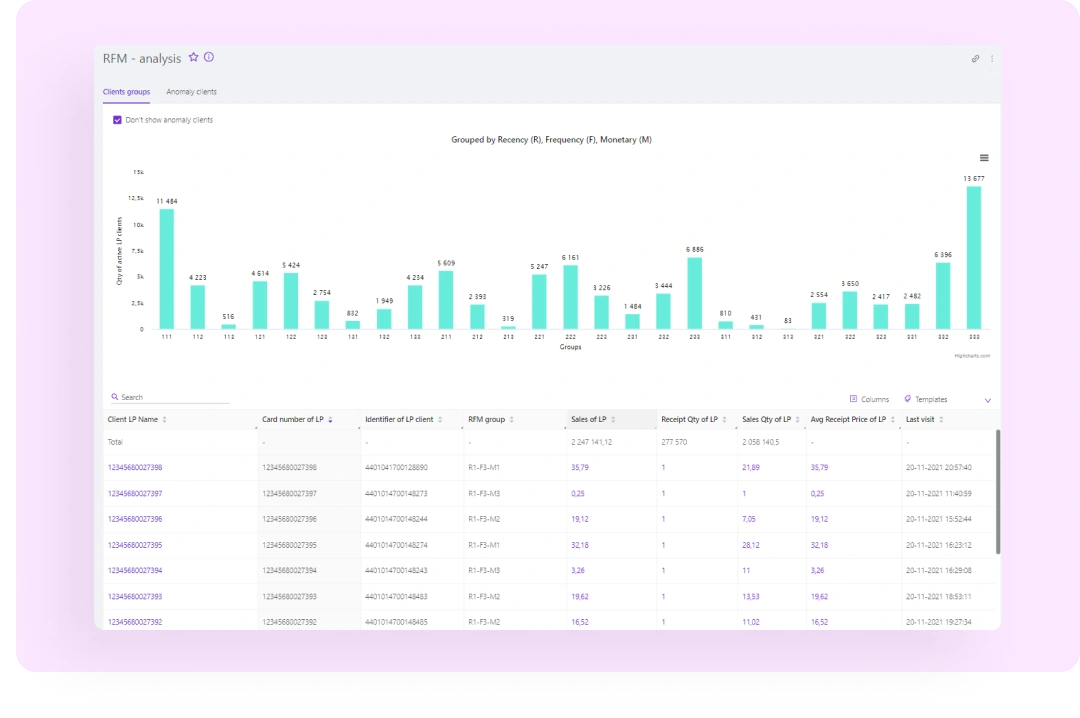
Promotions and marketing
Analyze the effectiveness of advertising campaigns and promotions to understand which ones bring the most profit and attract new customers. The Promotions Analysis report allows you to evaluate the impact of promotions on sales, and RFM analysis helps you identify the most valuable customers based on their behavior.
Metrics that allow you to assess the situation from different angles
Datawiz BI offers metrics that help you analyze your business in depth. They can be drilled down by different periods and sections, allowing you to understand what's happening in stores, categories, or brands.
The service provides 130 indicators that cover various aspects of the business:
from profit and average receipt to the age of loyalty program customers and the number of days when the product was not sold. This helps to create a complete picture and make effective management decisions.
Profit
Turnover
Client's age
Price
Average receipt
Loyalty
Order
Number of days
Datawiz provides constant access to up-to-date data,

which allows you to regularly monitor and analyze indicators at different stages throughout the day. This approach helps to respond quickly to changes and plan further business development.
Datawiz BI allows you to use not only standard metrics,
but also create unique indicators that consider your chain's specifics. This ensures maximum flexibility and efficiency of analytics.
Q&A
Descriptive analytics is the process of collecting and analyzing historical and real-time business data to answer the question "what is happening right now?" In retail, it covers sales performance, price dynamics, product turnover, supplier operations, assortment behavior, and customer activity — all structured into a clear, accessible picture for decision-making.
Datawiz BI collects data from a retail chain's systems and organizes it into more than 30 ready-made interactive reports across four main categories: sales, assortment, loyalty program customers, and promotions and marketing. Reports update continuously and can be filtered by store, category, brand, time period, and other dimensions without requiring manual data preparation.
Datawiz BI provides 130 standard indicators covering profit, revenue, average receipt, product turnover, price dynamics, order quantity, loyalty program data, and the number of days a product was not sold. All metrics can be broken down by store, region, category, brand, or individual SKU, and monitored across any time period — including intraday analysis.
Beyond the 130 standard metrics, Datawiz BI allows users to build custom indicators using the Formula Builder. This means teams can define metrics that reflect their specific business logic — for example, chain-specific margin calculations or composite KPIs — without relying on IT or development resources.
Descriptive analytics answers "what happened and what is happening now" — it structures historical and real-time data into reports and dashboards. AI analytics in Datawiz BI goes a step further, answering "why it happened" and "what will happen next" through machine learning models that detect hidden patterns, forecast demand, and generate automated recommendations. Both layers are available within the same platform.
Datawiz BI provides constant access to up-to-date data, with reports reflecting changes throughout the day. This allows retail teams to monitor key indicators at multiple points during business hours and respond quickly to deviations in sales, stock, or pricing without waiting for end-of-day summaries.
Descriptive analytics in Datawiz BI is used across multiple roles: category managers track assortment performance and promotion effectiveness, store managers monitor store-level KPIs, top managers review chain-wide revenue and profit dynamics, marketers analyze customer behavior and loyalty program results, and analysts build custom reports and dashboards for deeper investigation.
Retail chains using Datawiz BI report measurable improvements across key metrics: a 13% reduction in lost sales, a 15.5% decrease in excess inventory, an 11.2% increase in average check, and a 28% improvement in financial results per SKU. These outcomes result from faster detection of underperforming products, timely stock adjustments, and data-driven decisions on assortment and promotions.
Datawiz BI offers a free trial and an interactive demo environment where users can explore the full report library, test filtering and drill-down functionality, and evaluate how the platform works with sample retail data — no credit card required.
Make decisions based on real data!
 No credit card required