 What's new?

Inventory turnover ratio analysis in several steps
The inventory turnover ratio is one of the most important sales performance indicators that every store or chain manager should track. With its help, you can increase the profitability of your business and quickly eliminate existing gaps.
Why do you need to analyze the inventory turnover ratio?
Competent assessment of the turnover ratio has significant benefits for retail, namely:
- determines the duration of the sale of goods;
- proves the expediency of introducing/withdrawing good items from the assortment;
- indicates the need to adjust the individual norms of good stocks in a warehouse (store);
- allows you to optimize logistics and minimize delivery and storage costs;
- proves the performance of both individual store employees and the entire chain;
- helps to increase profits due to removing goods from the assortment.

How to calculate the inventory turnover ratio?
To analyze the goods turnover ratio, you should know that there are two groups of indicators:
- Turnover ratio - shows how many turnovers (from purchase to sale) the goods completed during the study period.
- Days sales in inventory - indicates how many days the good takes to complete one turn.
Inventory turns calculation
Indicator names | Formula |
Inventory turnover ratio | ITR = Turnover ÷ Avg inventory |
Days sales in inventory | DSI = (Avg inventory × Days) ÷ Turnover Days - number of days in select period |
Relationship between indicators: ITR = Days ÷ DSI or DSI = Days ÷ ITR | |
Note! There are two approaches to turnover ratio calculation in monetary units:
| |
So, with the help of these indicators, it is easy to understand how quickly goods are sold and returned invested money, or vice versa -they indicate problem areas and "freezing" of money into stock inventory.
What is a sequence of turnover ratio analysis?
Turnover analysis requires an accurate sequence.
Step 1: Calculation of product/category/brand turnover ratio
Firstly, you need to analyze the turnover ratios for each good item. For this, the following indicators will be useful:
- Turnover / Cost of sales;
- Margin, %;
- Average inventory;
- Turnover ratio (turns);
- Days sales in inventory (days).
With their help, you can identify the most profitable goods for the store and goods that should be removed from the assortment due to they are unprofitable.
At this stage, you can compare turnover ratios for identical product groups, and brands, or conduct a comparative analysis between different stores.
It will be useful to form a quadrant of turnover ratio indicators:
The quadrant of turnover ratio
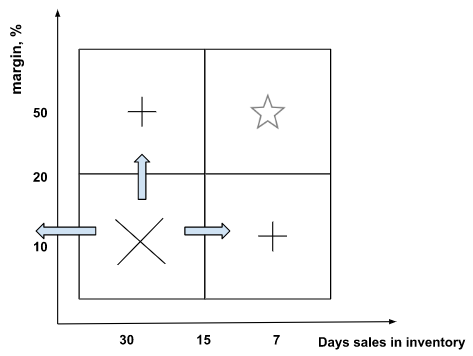
To build a quadrant, all goods should be divided into 4 groups (quadrants):
- Group 1:low margin and low turnover ratio - goods that sell poorly and do not make a profit.
- Group 2:high margin and low turnover ratio - goods that generate significant profits over a longer period.
- Group 3: high margin and high turnover ratio - the most interesting group of goods for the retailer, and it should be expanded.
- Group 4: low margin and high turnover ratio - goods that do not bring a large amount of profit, but are quickly sold.
Recommendation!The most problematic group is the "low margin/low turnover ratio". It is worth getting rid of it or transferring it into another group:
- increase the price and follow the turnover ratio. If the turnover ratio is not reduced, then such goods will generate more profit for the store.
- increase the turnover ratio by conducting promotions and advertising.
Step 2: Estimation of the turnover ratio in dynamics
It is necessary to count the turnover rates in comparison with previous periods. At the same time, it is worth remembering that the indicators of the inventory turnover ratio have a different positive trend:
- The increase in the turnover ratio (turns) indicates an acceleration in sales;
- The decrease of days sales in inventory (days) confirms that goods are sold in fewer days.
!The desired situation for the retailer: ↑ITR and ↓DSI, which indicate an acceleration in the turnover of goods and the release of monetary funds from circulation.
Step 3: Determination of the amount of released/frozen money into stock inventory
Comparing the turnover ratios for several periods, you can understand whether the money was released from circulation, or vice versa - it was "frozen". You can calculate the amount of released/"frozen" monetary funds using the formula:
Е = Turnover for the select period / Days × (DSI for the select period - DSI for the previous period)
Note! If E > 0< - it indicates the amount of "frozen" money, and if E < 0 - it indicates the amount of released money.
Example: Product A was sold in April for the amount of $10,000. Days sales in inventory in April are 7.8 days, and in March - 7.2 days.
Е = $10000 / 30 × (7.8 - 6.4) = $466.67 - the amount of "frozen" money into stocks in April.
For such a product, all recommendations can be aimed at:
- Increasing sales: price reduction, the conduction of promotions or promotions.
- Decreasing inventory: returning to a supplier, reducing orders for that item.
You can evaluate the inventory turnover ratio with the necessary detail (regions/stores/categories/products) using reports and dashboards on the BI.Datawiz analytical platform for retail. They allow you not only to quickly and accurately calculate the values of indicators, but also to track their changes in the visualizations.


 No credit card required