 What's new?
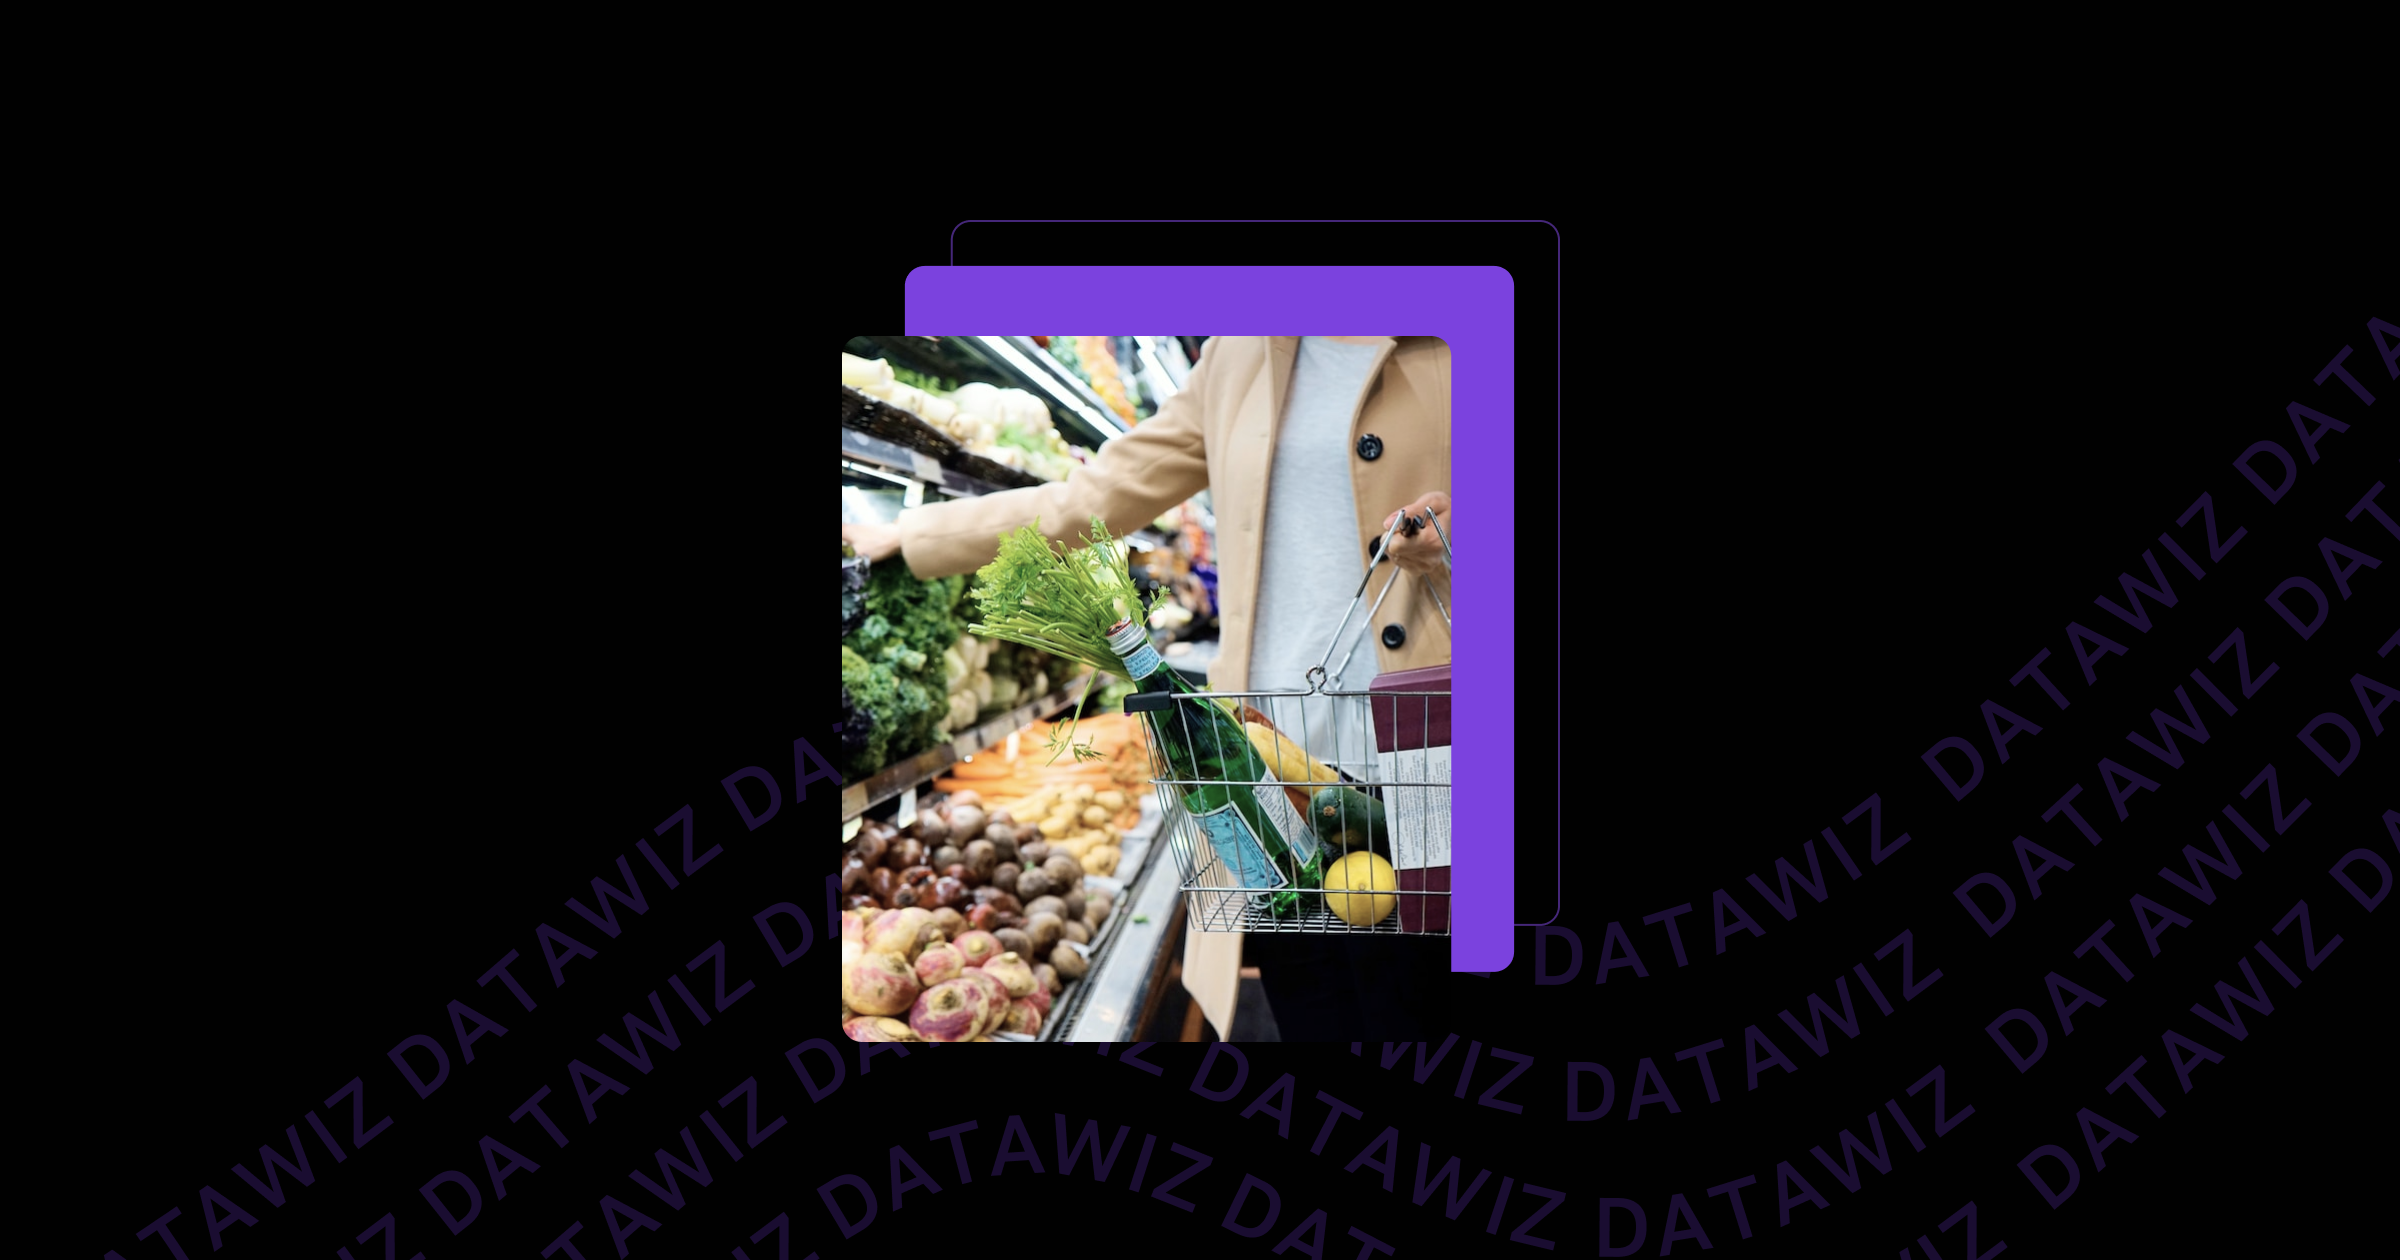

Market Basket Analysis: How to Understand Customers’ Needs?
Customer behavior is important information for every retailer. Since its correct understanding and ability to predict allows:
- increase loyalty and the number of customers by↑15%;
- grow business marginality by↑1.5 times by optimizing the assortment that meets the expected demand of customers;
- minimize "non-liquid goods" on store shelves;
- develop highly effective marketing ads and create "product packages" that are beneficial for the chain.
How to analyze the customer basket?
Interesting fact! Each customer's purchases in the store are not unique. Buyers are characterized by certain behaviors that are formed based on their needs. For example, buying bread and milk every other day, cigarettes every evening, and a croissant and yogurt at lunchtime. Therefore, if you take into account the general needs of customers, you can identify typical buying behavior.
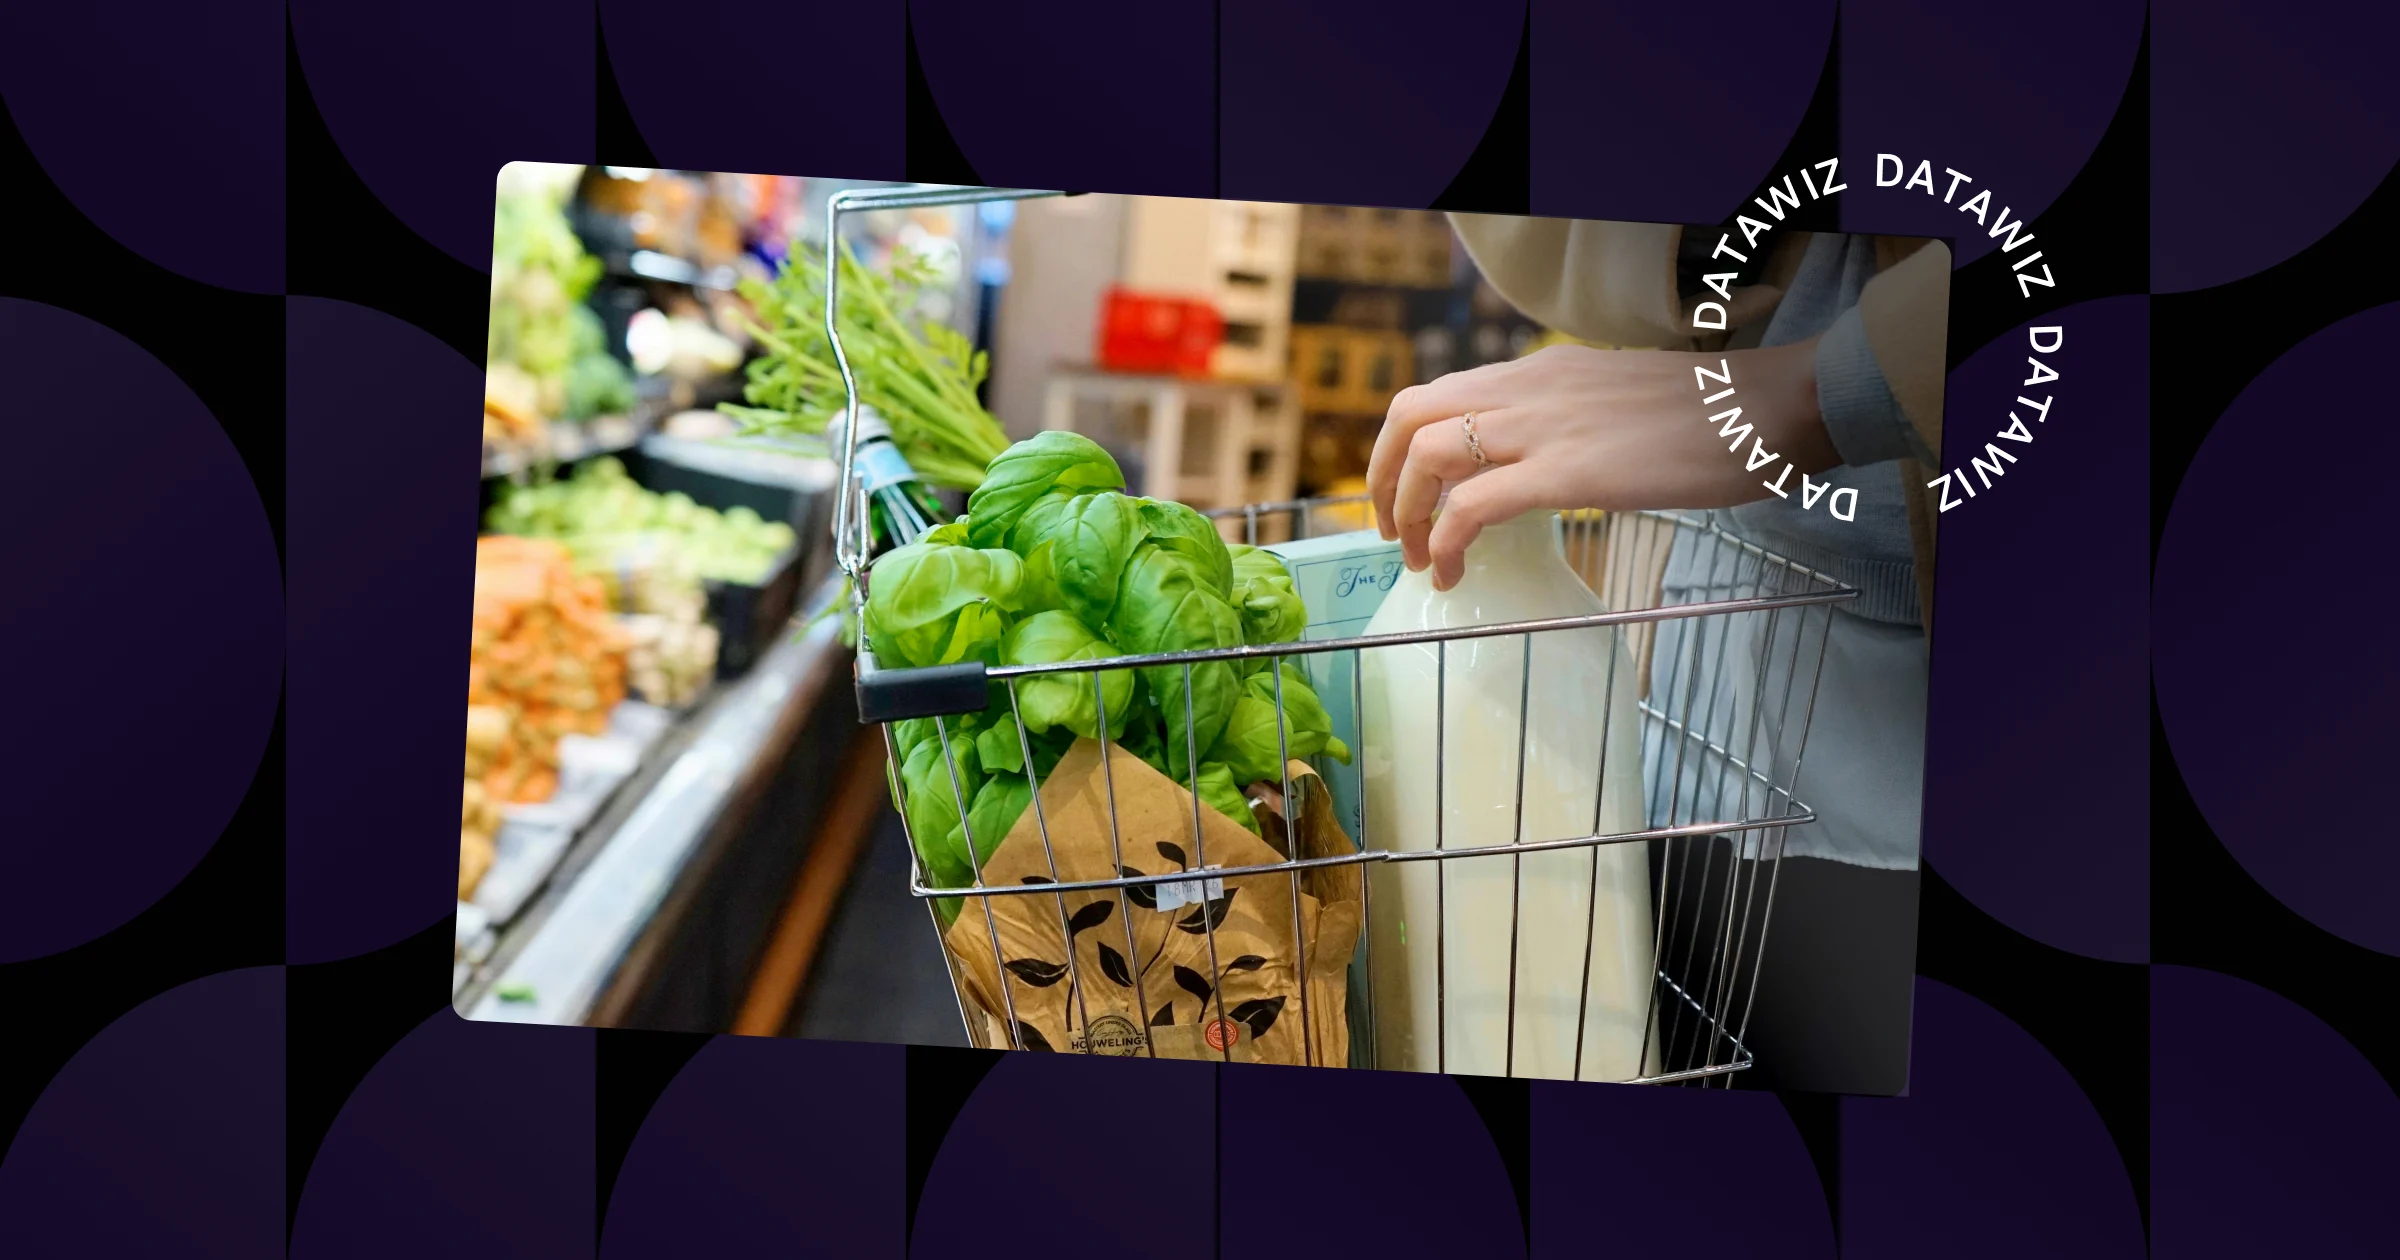
An effective technique for identifying customer behavior patterns is the analysis of shopping baskets.
Market Basket Analysis is a set of analytical approaches aimed to study customer behavior and product selection, establishing associations and relationships between products in each receipt, and assessing the likelihood of buying products together.
!The main source of data for such an analysis is the chain receipts, which record:
- date of purchase;
- time of purchase;
- a list of items purchased together;
- selling prices;
- the total value of the receipt.

Such information allows category managers to answer many questions, for example:
- What does a "typical" customer's basket on a Saturday night include?
- What items are included in baskets over $50?
- With what do customers buy dairy products?
- What brands are included in receipts with Coca-Cola?
There is a wide range of algorithms for basket analysis (Apriori, Eclat, FP-Growth, etc.). All of them reveal association rules in receipts - links between products that are repeated in market baskets.
The association rules are: "If buyers buy product X, then with a certain probability they will also buy product Y".
Initial data for the association rule:
- X - key product - the reason for the purchase;
- Y- accompanying product - a consequence of the acquisition of a key product.
Example.To apply the Association Rules, let's take 10 receipts with the following 4 products: Cereals, Bread, Butter, and Mineral water:
- 1st receipt: Butter, Bread;
- 2nd receipt: Bread;
- 3rd receipt: Cereals;
- 4th receipt: Cereals, Bread, Butter;
- 5th receipt: Bread, Butter, Mineral water;
- 6th receipt: Cereals, Mineral water;
- 7th receipt: Bread;
- 8th receipt: Cereals, Butter;
- 9th receipt:Cereals, Bread;
- 10th receipt: Butter, Mineral water.
Let's accept and consider the rule: "If customers buy Cereals and Bread (X), then they will buy Butter (Y)".
To determine the likelihood of such a purchase, it is necessary to calculate the following indicators:
- Support- an indicator that is calculated for one product or a pair of products. It shows the ratio of the number of receipts with the selected product/pair to the total number of receipts.
The combination of 3 selected products Cereals, Bread and Butter is displayed in the indicator:
Support X = Number of receipts with X ÷ Total number of receipts = 2 ÷ 10 = 0.2
Support X&Y = Number of receipts with products X and Y ÷ Total number of receipts = 1 ÷ 10 = 0.1
The higher the value of the indicator, the more often the rule is triggered for the general data array.
- Confidence shows the ratio of receipts X with Y to receipts in which only the key product X is present.
That is, the indicator reveals what is the probability that the buyer will simultaneously buy three products: Cereals, Bread, and Butter.
Confidence = Support X & Y ÷ Support X = 0.1 ÷ 0.2 = 0.5
In our example, the probability of such a purchase is 50%, because of the two receipts with Cereals and Bread, one also contains Butter.
- Correlation coefficient determines how similar the dynamics of sales of two products are. There are 3 options for the correlation of the product sale:
- Correlation Coefficient>0 is a positive correlation, in which the sales charts of products are similar or identical;
- Correlation coefficient = 0, at which the sales charts of products differ significantly;
- Correlation coefficient < 0 – negative correlation, in which the sales charts of products are opposite (sales of one product are growing, and sales of the second product are falling).
Market Basket Analysis informs about the combination of products in a typical shopping basket. But often this information is obvious or already known to the retailers, based on their experience or the popularity of the products. The analysis of baskets to determine the implicit relationships between products is more valuable.
Important!To avoid errors, you should carefully approach the formation of incoming analysis data. For example, products placed near the checkouts should not be included in analytical estimates, since they are bought only because they came to the attention of the clients while they were standing in line.
Directions for Market Basket Analysis
To conduct a detailed and comprehensive analysis of baskets, the reports of the analytical platform BES.Datawiz provides filtering of baskets:
- by periods, days of the week, and time intervals. For example, to identify typical baskets for weekdays and weekends, different seasons, and periods before holidays.
- by the cost of receipts - allows you to define typical baskets of different price categories. For example, to determine which products are included in receipts from $100 to $200, from $500 to $1000, etc.
- by categorization levels (different product groups). For example, "Milk and dairy products" is a top-level category, it is divided into subcategories - dairy and sour milk products. In turn, fermented milk products are divided into yogurts, kefir, and fermented baked milk of different brands. The bottom level of categorization is the specific product name.
- by brand - determines which brands are included in a typical customer's basket. For example, most often customers buy Coca-cola with Lays chips and Carlsberg beer with Pringles. It is useful and informative to conduct analysis by combining certain products with brands or categories.
How to use the results of basket analysis?
The combination of several types of filtering when analyzing customers' baskets allows the retailer to structure the necessary information about purchases, develop promotional strategies correctly, and, as a result, increase profits.
The results of such an analysis are the basis for making management decisions focused on increasing sales and average receipts. In this case, you should take into account those factors that may affect the entry of products into the basket:
- buying habits of customers;
- advertising and promotions;
- public opinion and established traditions;
- product layout;
- availability of products on the shelves, etc.
With basket analysis, a retailer can:
- Optimize product display. For example, it is appropriate to place paired products side by side to increase the likelihood of their purchase. Or vice versa, it is appropriate to place products with a high probability of purchase with a significant gap from each other, and between them layout a third product that is important to sell for the chain.
- Create promotions. An example of a promo idea is to provide a discount before the holidays on expensive sweets when buying vermouth.
- Develop targeted advertising. Formation of special offers for different customer groups on key and related products.
- Understand the needs of customers at different time intervals. This allows you to create an optimal assortment that will satisfy the desires and expectations of customers.
With the help of BES.Datawiz analytical platform reports, you can extract the most useful information from your data and scale your business.


 No credit card required