 What's new?

What is retail sales analysis
Retail sales analysis is a set of activities to assess the quality of decisions made and to correct problems in the sales process in order to increase profits. Sales data is a key input for analysing shop performance.
The role of sales analysis in business development
Sales analysis is a strategically important tool for assessing a company's level of development relative to the market. With the help of the sales analysis it is possible to:
⦁ assess the efficiency of the shop and its' managers;
⦁ make decisions that contribute to an increase in sales performance;
⦁ make clear forecasts on product sales processes, etc.
Basic methods of sales analysis
There is number of ways to analyse shop sales according to different criteria. Each individual method of sales analysis allows you to evaluate the effectiveness of the shop strategies used on one side or the other. Let's take a look at the most popular ones:
⦁ ABC-analysis
This research method allows to create shop goods classification and determine the profitability of the items by category. The ABC-sales analysis method uses the Pareto 80/20 method. The classification of the objects of analysis depends on its' objectives and is divided into 3 groups:
- Group A - the items with the highest profits (80% of the profits from sales of 20% of the range).
- Group B - goods with stable average demand.
- Group C - the category of goods with the lowest profitability.
⦁ XYZ-analysis
The data of XYZ-analysis demonstrates the uniformity of demand which is a key parameter in optimising the range of retail products in the retail chain. The goods are grouped according to the coefficient of variation:
- Group X - goods with a coefficient of variation of 0-10%. This is an indicator of the stability of demand, which does not change by more than 10% per month.
- Group Y - goods with a coefficient of variation of 10-25%.
- Group Z - goods with the least predictable demand - variation of more than 25%.
Fluctuating demand shows the value of a particular product group in terms of profitability and gives a greater insight into the realism of sales targets.
⦁ Determining profitability
Profitability is a measure of a company's profitability, the economic efficiency of the funds invested.
Formula:
Return on sales = Profit on sales / Revenue
Large revenues do not equal large profits. A loss-making business is the object of a tax audit.
The XYZ method of sales analysis emphasises the economic aspect of sales. A negative result of dividing net profit by revenue will tell you that you are operating at a loss.
⦁ Analysis of sales dynamics
Sales dynamics is the change in the sales performance of one period compared to previous periods.
Sales dynamics analysis is an assessment of the change in sales (turnover) over time.
The method allows you to understand how much revenue has changed compared to the previous period. The indicators used for the analysis are:
- Change in turnover = Turnover for the current period - Turnover for the previous period
- Turnover growth rate, % = Current period turnover / Last period turnover * 100%
- Turnover growth rate, % = Turnover growth rate, % - 100%
For example: The shop's turnover in January was 200 thousand UAH and in February it was 180 thousand UAH.
- Change in turnover = 180 - 200 = - 20 thousand UAH
- Turnover growth rate, % = 180 / 200 * 100% = 85%
- Turnover rate, % = 85 -100 = - 15%
In February, for example, turnover fell by 15% to only 85% of the turnover for the month of January. This negative situation calls for a detailed factor analysis in order to determine the reasons for this slump in sales.
In BES platform reports such calculations are automatically performed with the desired level of detail (in terms of shops, categories, products, category managers, etc.). For better visibility each calculated figure is clickable and accompanied by a visualisation:
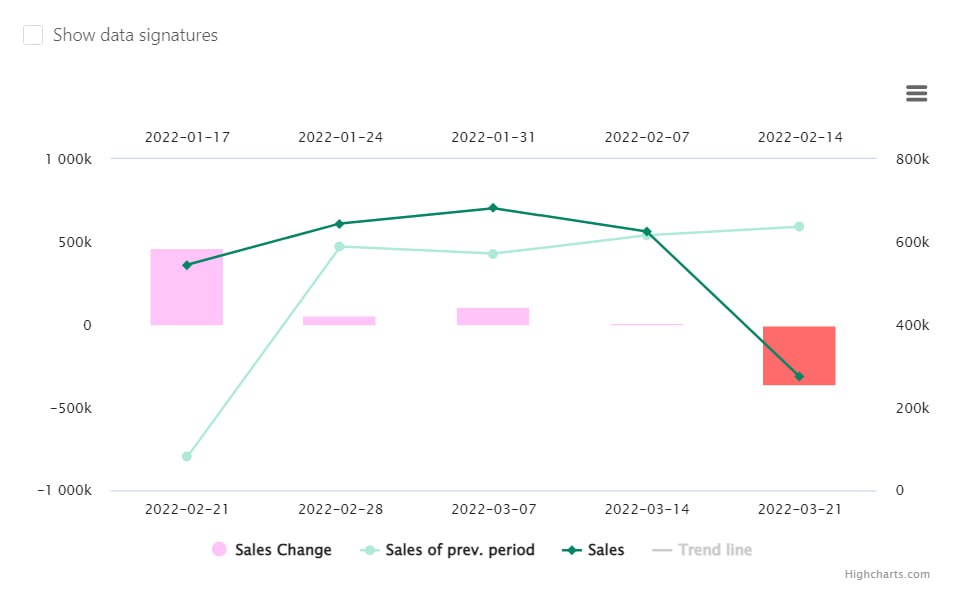
Chronology of changes in indicators will help infer the speed of the company's development and trends in demand. As in the case of determining profitability the dynamics of sales are calculated using the formula:
Dynamics = Sales for the reporting period/Sales for the previous period * 100%
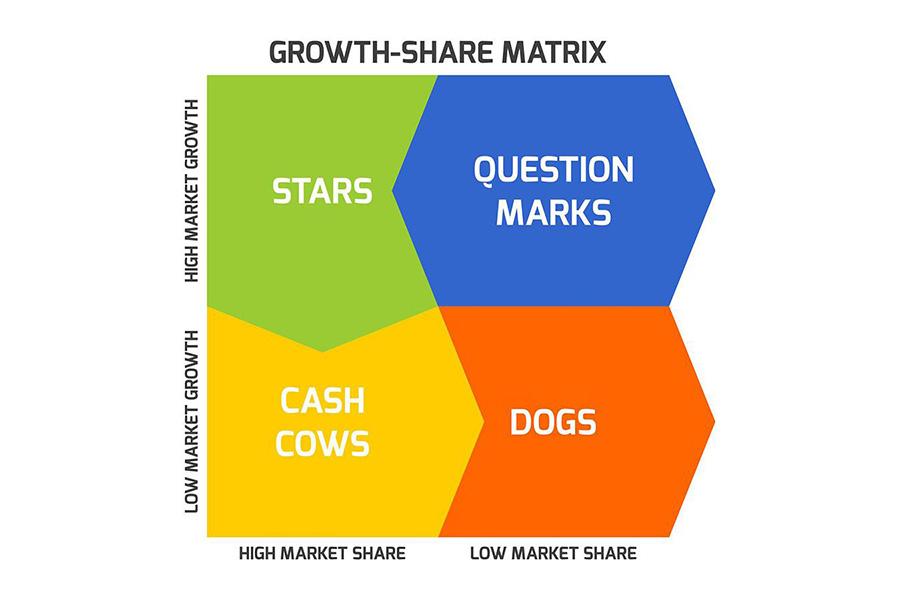
⦁ BCG matrix analysis
The creative approach to product segmentation by profitability, invented by Bruce Henderson, has not lost its effectiveness to date. The purpose of using this method is to analyse the relevance of products in relation to demand growth. We discussed the use of this matrix in more detail here: BCG Matrix: Efficient Chain Assortment Management
⦁ The plan fulfilment analysis allows you to understand the extent to which the shop has achieved its sales targets, i.e. the extent to which the plan has been fulfilled or under-fulfilled. Calculation formula:
% of turnover plan fulfilment = Turnover actual / Turnover plan * 100%
If the value is ≥ 100%, the plan has been met or exceeded and if it is <100% - the plan is under-implemented and the reasons for this negative situation should be investigated.
This indicator can be calculated for individual products, categories, shops, category managers. This can be analysed not only in terms of turnover but also in terms of other indicators: profit, average bill, margin, etc.
For example: The sales plan for February was 220,000 UAH and in February the turnover was 180,000 UAH.
% of turnover implementation = 180 / 220 * 100% = 81.8%
The turnover plan for February, for example, was 8.2% short of its target. This may be a critical situation for the network and it is worth understanding what caused it so that the causes can be addressed.
A powerful tool for this analytical method is the Sales Plans report on the BES platform. It can be used to assess the fulfilment of the plan for various sales indicators (turnover, profit, margin, markup, average receipt, etc.) in the context of shops, categories, category managers.
The results of the plan execution analysis allow timely adjustments to be made in the event of discrepancies between actual and planned sales. The BES platform provides data analytics for each individual outlet as well as for the network as a whole.
⦁ Factor analysis of sales
Using the results of the factor analysis method, it is possible to clearly identify specific factors affecting the sales of goods. Among the most common are:
- fluctuating sales volume;
- the dynamics of the range of goods sold;
- the impact of changes in production costs;
- changes in selling prices of products.
The results of the sales factor analysis show the maximum possible ways of increasing profits. It is best to compare 2 periods: the current period and the previous one.
⦁ Structure of the receipt
The point method of retail sales analysis. This method can be used for SKUs analysis -how many and which specific items are sold in one shop. Formula:
SKU = Sum of SKUs sold to each outlet / Total number of outlets
In addition, the analysis of the check structure allows the effectiveness of the relationship between turnover and merchandising to be traced. It is most effective in large retail chains. It is useful together with the previously covered shopping cart analysis.

Using data visualisation tools
The more data from different sources are analysed the more difficult it becomes to assess them objectively. The visualisation of data makes it much easier to interpret and make sense of the information.
The BI tool on the BES platform can easily help with this. Fast data collection and processing allows the results of a wide variety of metrics to be compared. Converting analysis data into visual dashboards using the Buildertool helps you to make management decisions quickly.
Tips for data analysis
⦁ A focus on internal indicators
The success of data analysis can be considered not only as impressive revenue figures, but also as better KPI implementation by departmental managers and, as a result, the efficiency of business processes. If in doubt when making a decision, analyse possible risks using the SWOT method.
⦁ Updating marketing data
Sales analysis is recommended to be done on a regular basis. The quicker you react to changes in customer preferences, the more profitable your sales business will be.
⦁ Refinement of the sales plan
The influence of external factors (e.g. promotions, merchandising, advertising campaigns) can influence the sales plan both positively and negatively. Monitor the impact of such specific instruments on a short time frame.
Conclusion
Sales analysis in retail plays a major role not only in calculating key economic indicators, but also in correcting most processes within a company. The more detailed the sales analysis obtained by the employees, the faster the profitability of the retail chain increases.


 No credit card required