


About the client
TA-DA! is a Ukrainian chain of home goods supermarkets. The company started in wholesale in 2000 and has operated as a retail chain since 2019.
| Segment | Home goods supermarket chain |
|---|---|
| Scale | 67 supermarkets in 29 cities, 30,000+ SKUs (as of late 2025) |
| Who uses BI | Commercial department, category managers, and leadership: about 20 regular users |
| Time on Datawiz BI | 6 months |
- 15–30 minutes for checks that used to take several hours or a full workday
- Dozens of hours saved by the commercial team every week (client estimate)
- ~20 users work in Datawiz BI regularly, from category managers to executives
Before Datawiz BI: 1C, Excel, and manual reporting
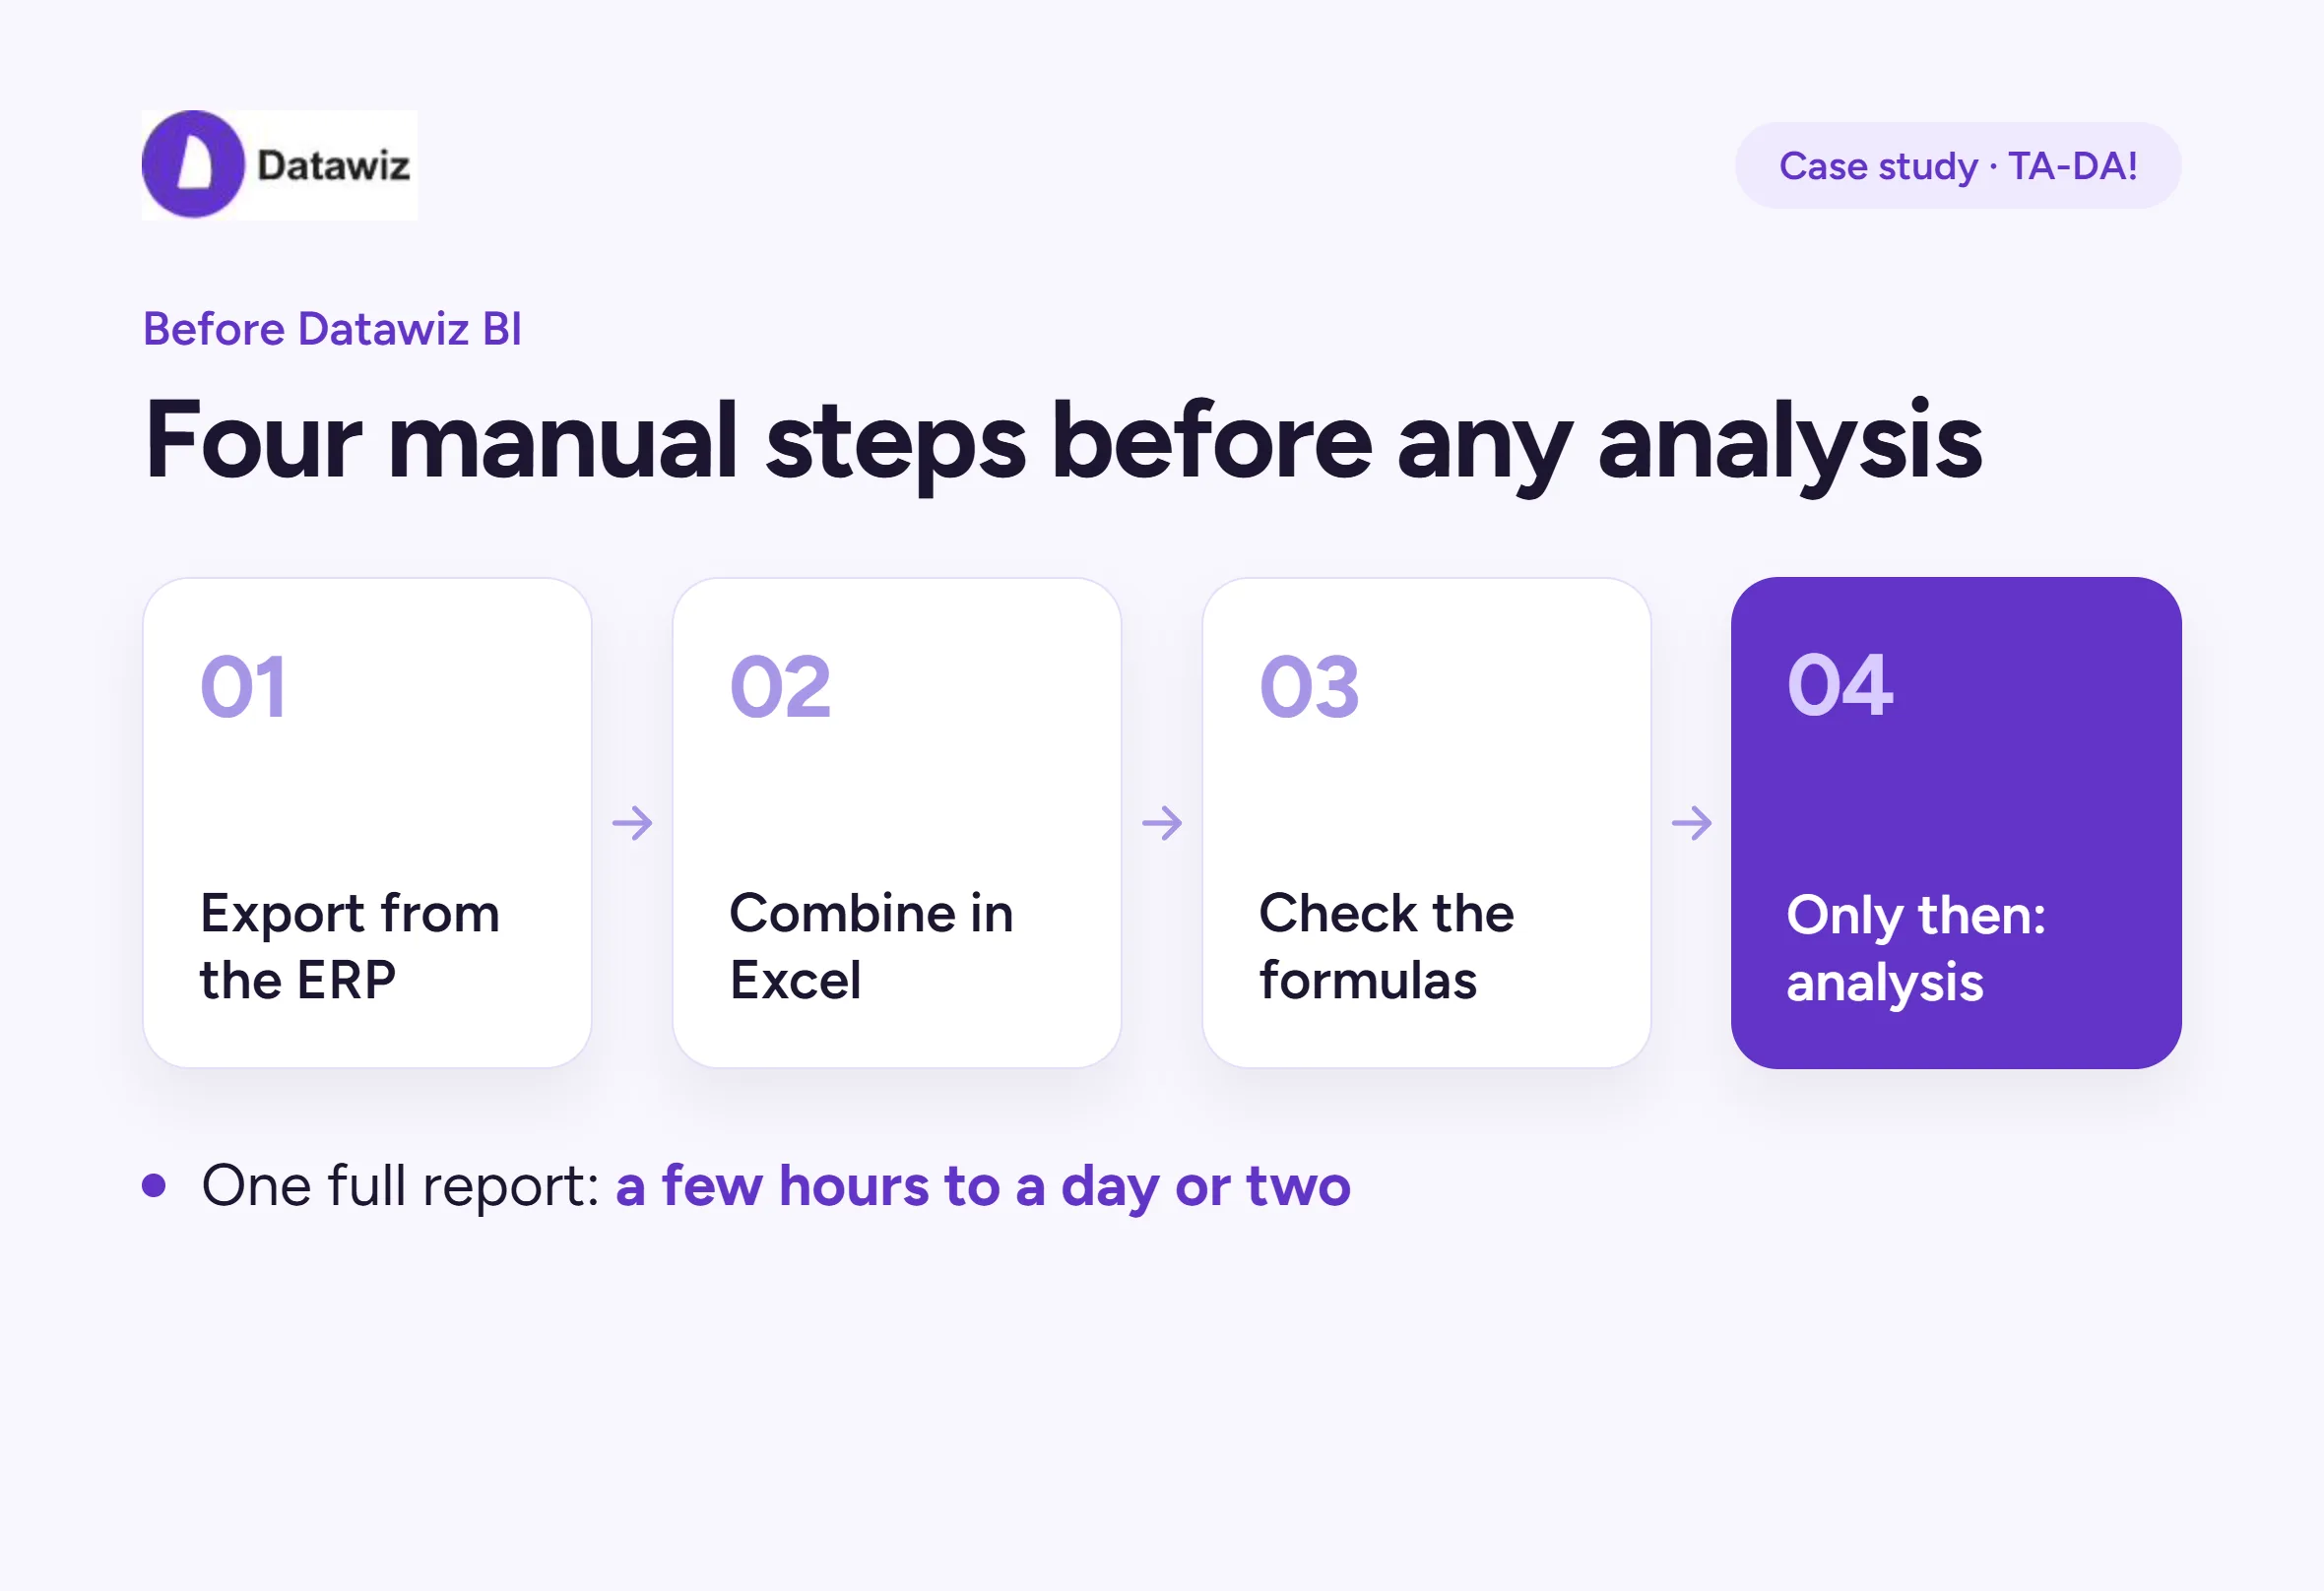
Analytics ran on 1C reports and Excel. Every question followed the same path:
- Export data from the ERP system.
- Consolidate it into separate spreadsheets.
- Check the formulas.
- Only then start the analysis.
The team got the numbers it needed, but only after hours of manual work. A full report could take anywhere from a few hours to a day or two.
Quick questions weren’t quick either. Checking a single category, product, store, or supplier often meant pulling a fresh export and starting over.
Why TA-DA! outgrew Excel: 14 new stores in one year
In 2025 alone, TA-DA! opened 14 new supermarkets. It also launched its first multi-format location: a supermarket, coffee shop, fitness studio, and kids’ playroom under one roof. More stores meant a bigger assortment and more decisions to make every day.
“At this scale, Excel no longer gave us the speed or level of detail we needed.”
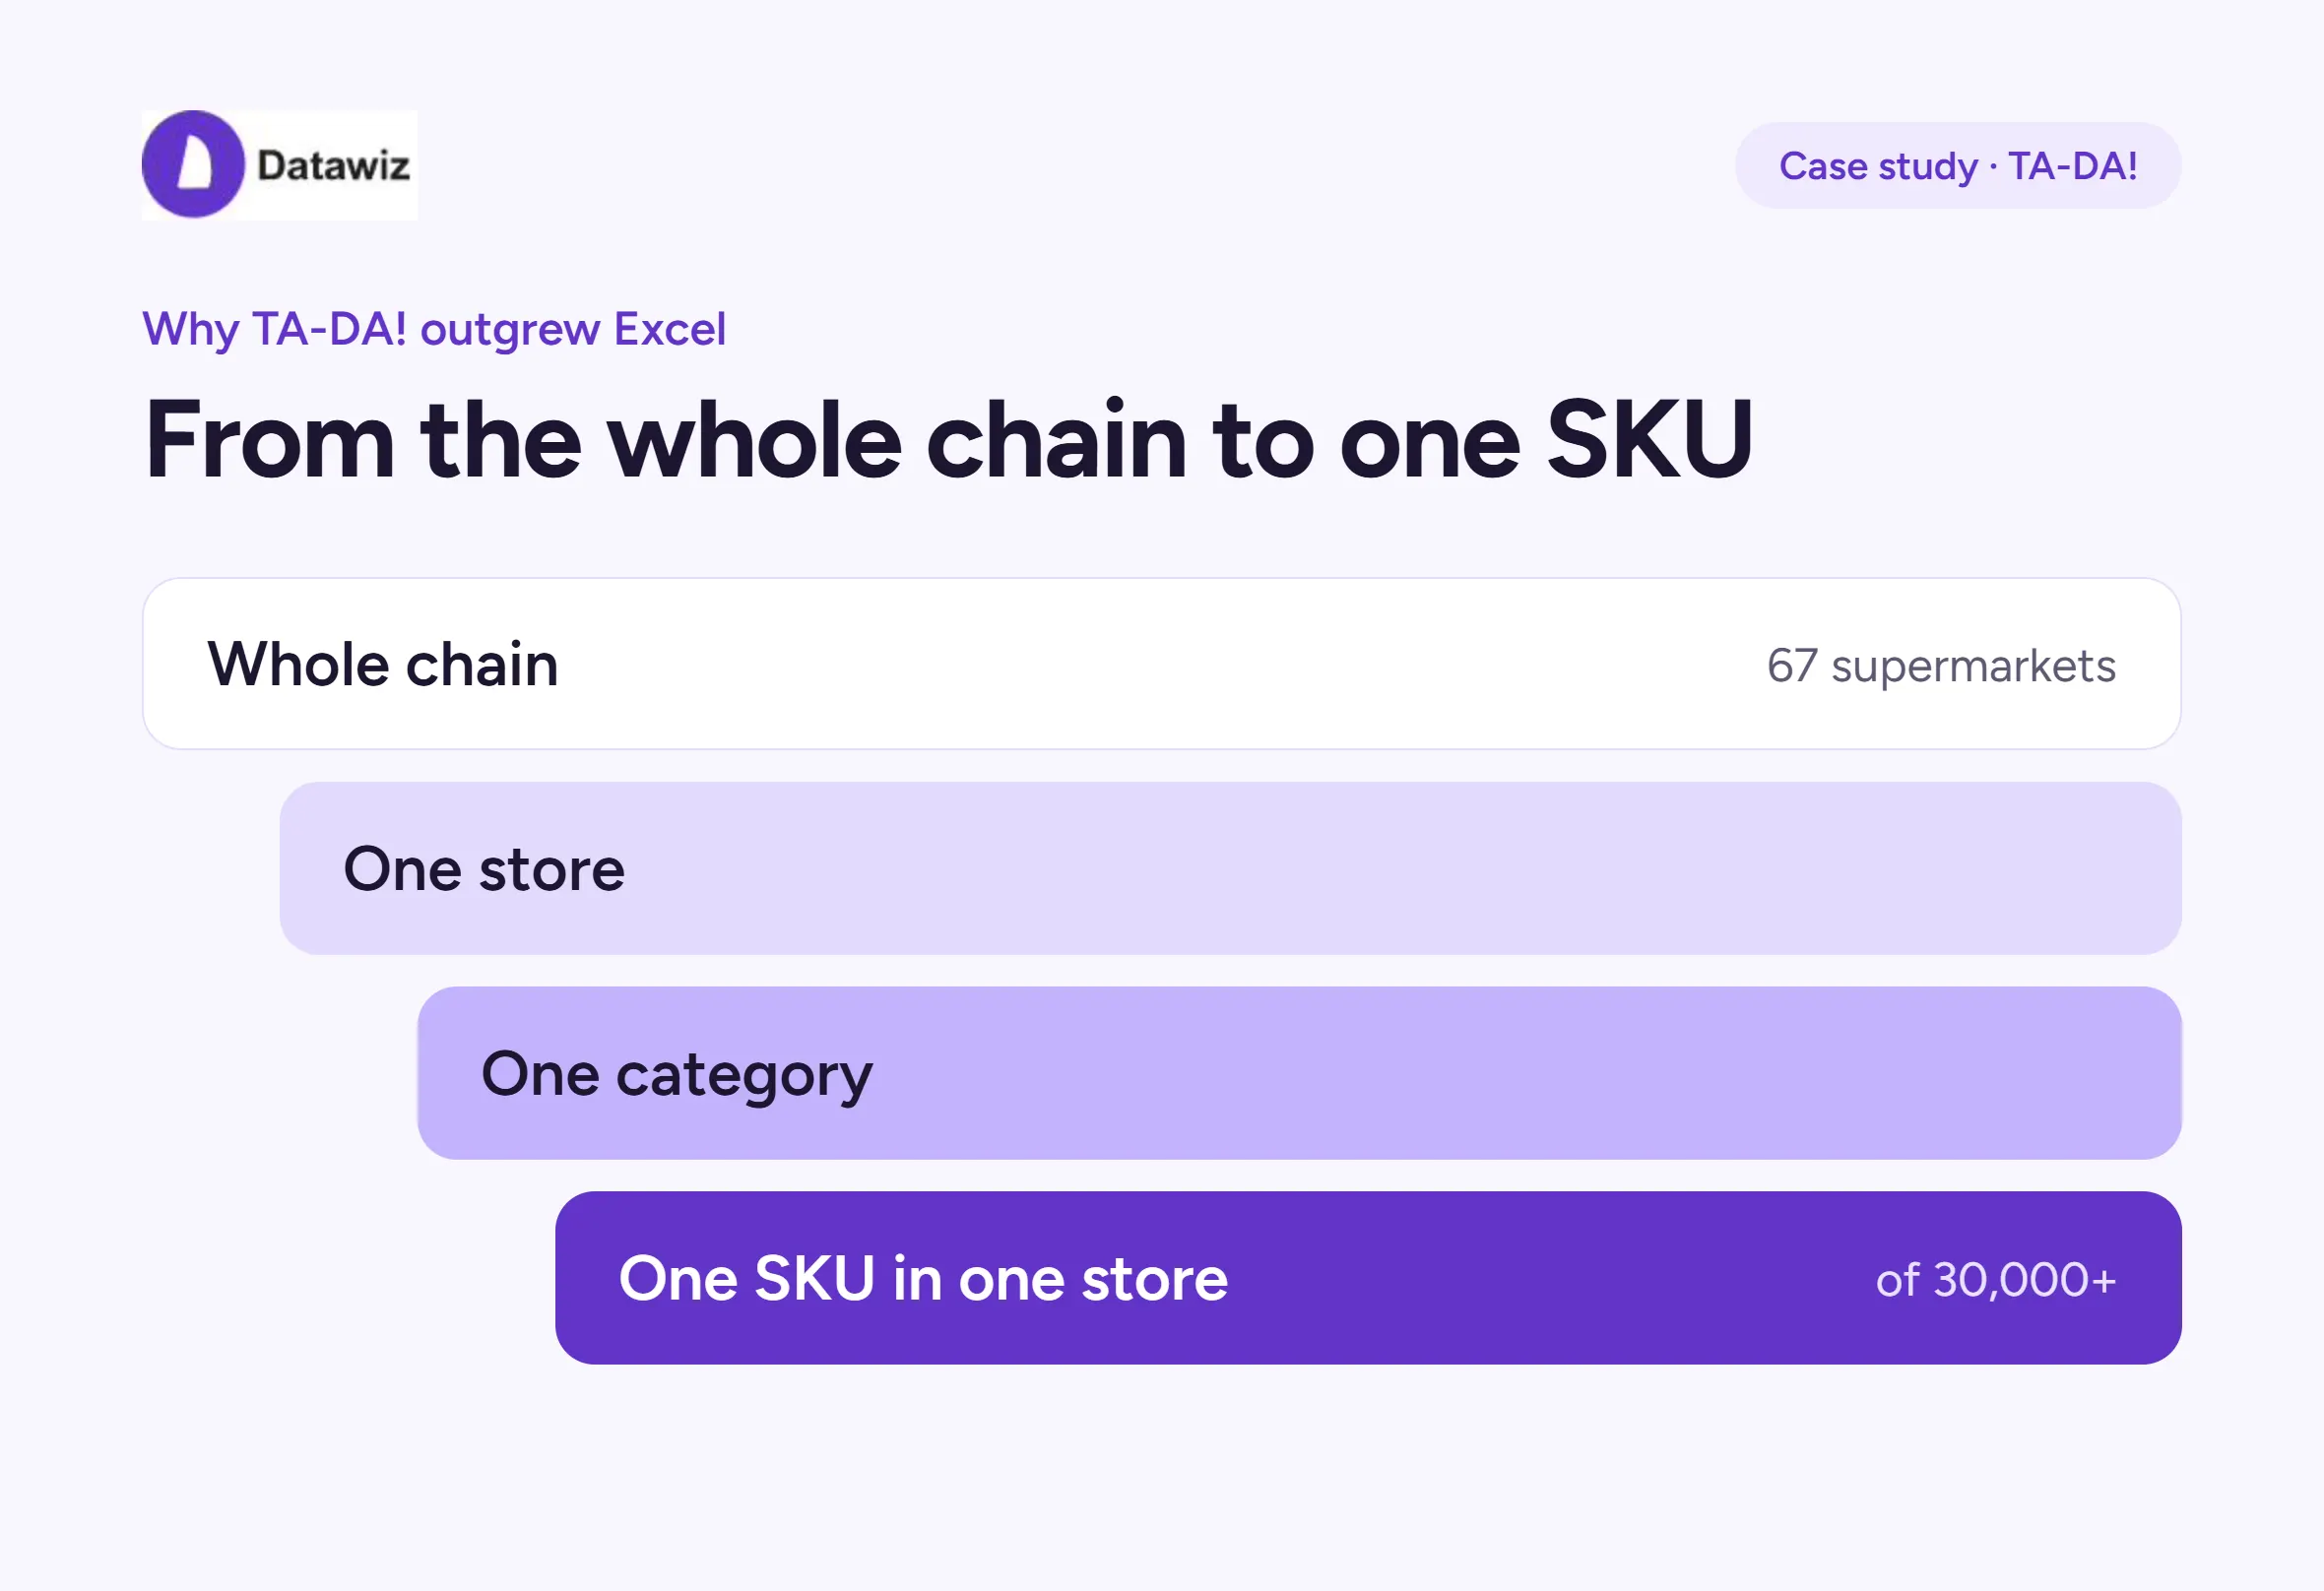
The team needed a tool built for retail. They wanted to see sales, profit, inventory, turnover, GMROI, and out-of-stocks at every level, from the whole chain down to one SKU in one store.
Implementation: the real work was getting everyone on the same metrics
Once the data feed was connected, the first basic reports were ready fairly quickly. From there, the team gradually shaped reports, filters, and metrics around how the chain actually works.
The technical side was the easy part. The harder part was getting everyone on the same page:
“The most important thing wasn’t learning how to open reports. It was building a shared understanding of the metrics and how to work with them.”
Once that was in place, Datawiz BI became part of the daily routine.
How TA-DA!’s category managers and leadership use Datawiz BI day to day
Six months in, Datawiz BI is one of the main tools the team opens every day.
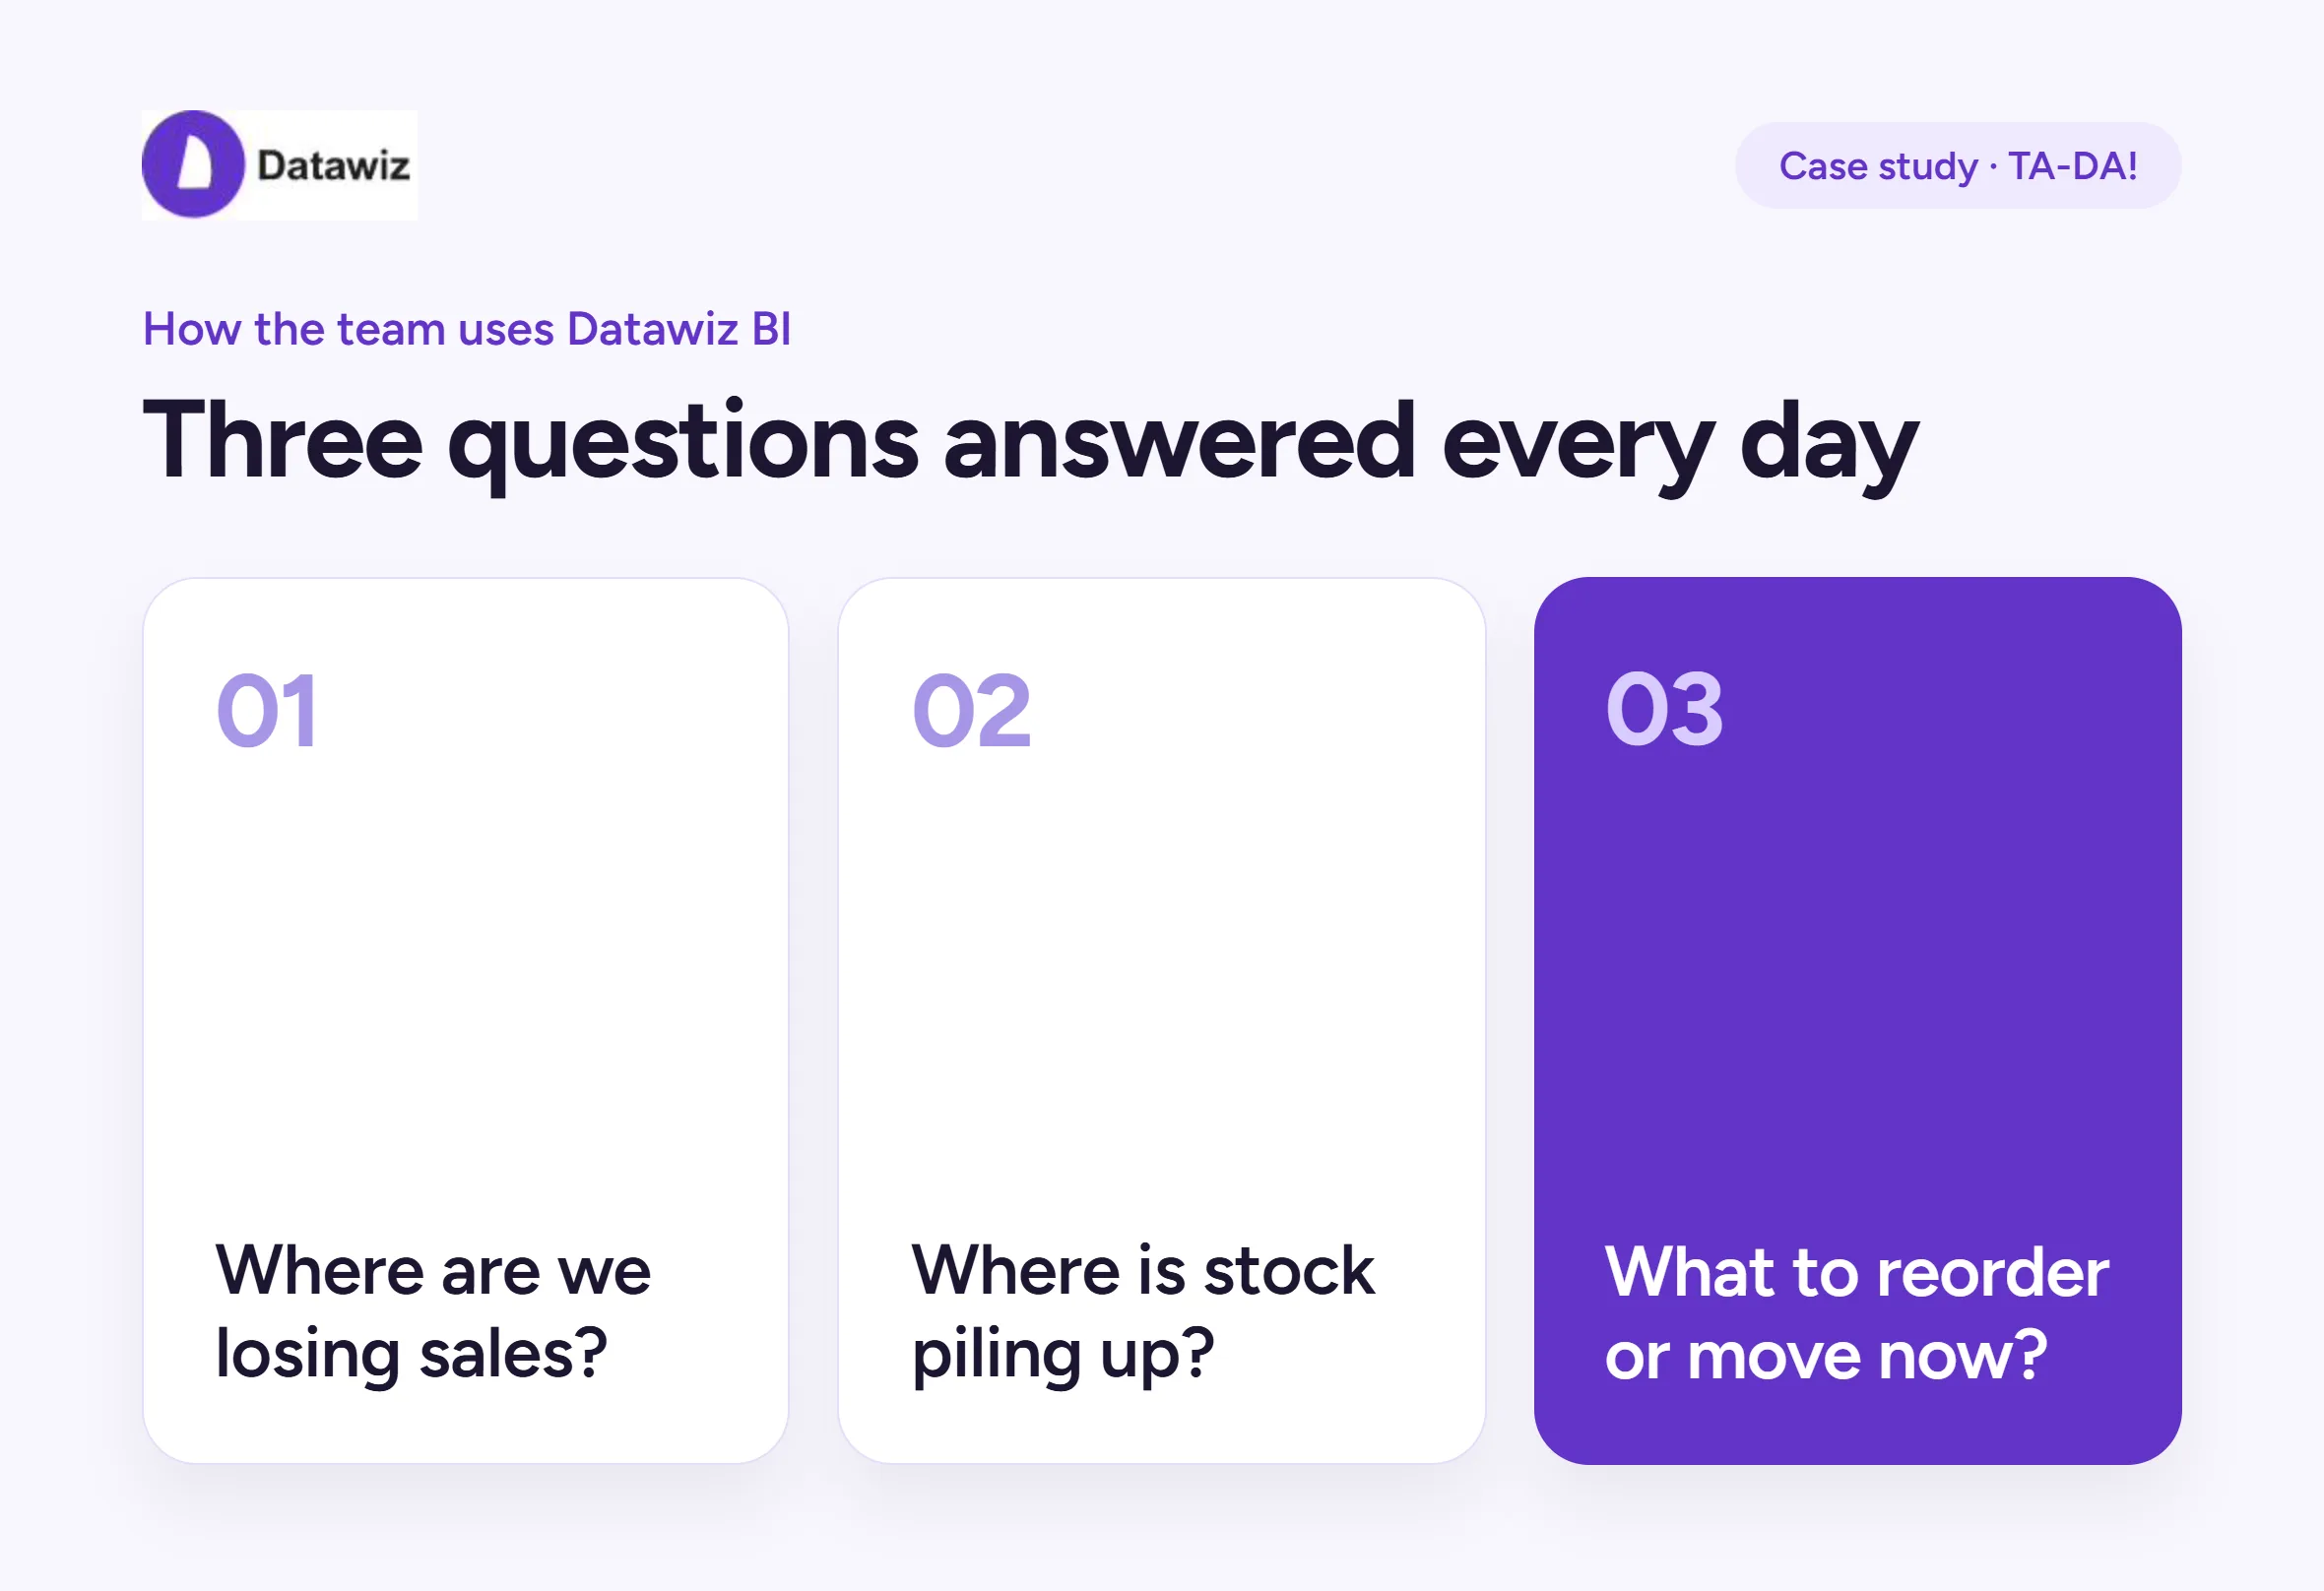
The most-used reports cover sales, profit, markup, inventory, turnover, GMROI, suppliers, products, and on-shelf availability. Together, they answer three questions: Where are we losing sales? Where is stock piling up? What needs to be reordered or moved right now?
| Role | How they use Datawiz BI |
|---|---|
| Category managers | In it almost every day. They track their categories, dig into variances, and review how products and suppliers are performing. |
| Leadership | Keeps an eye on chain-wide trends and problem areas. |
Mini case: move stock before you buy more
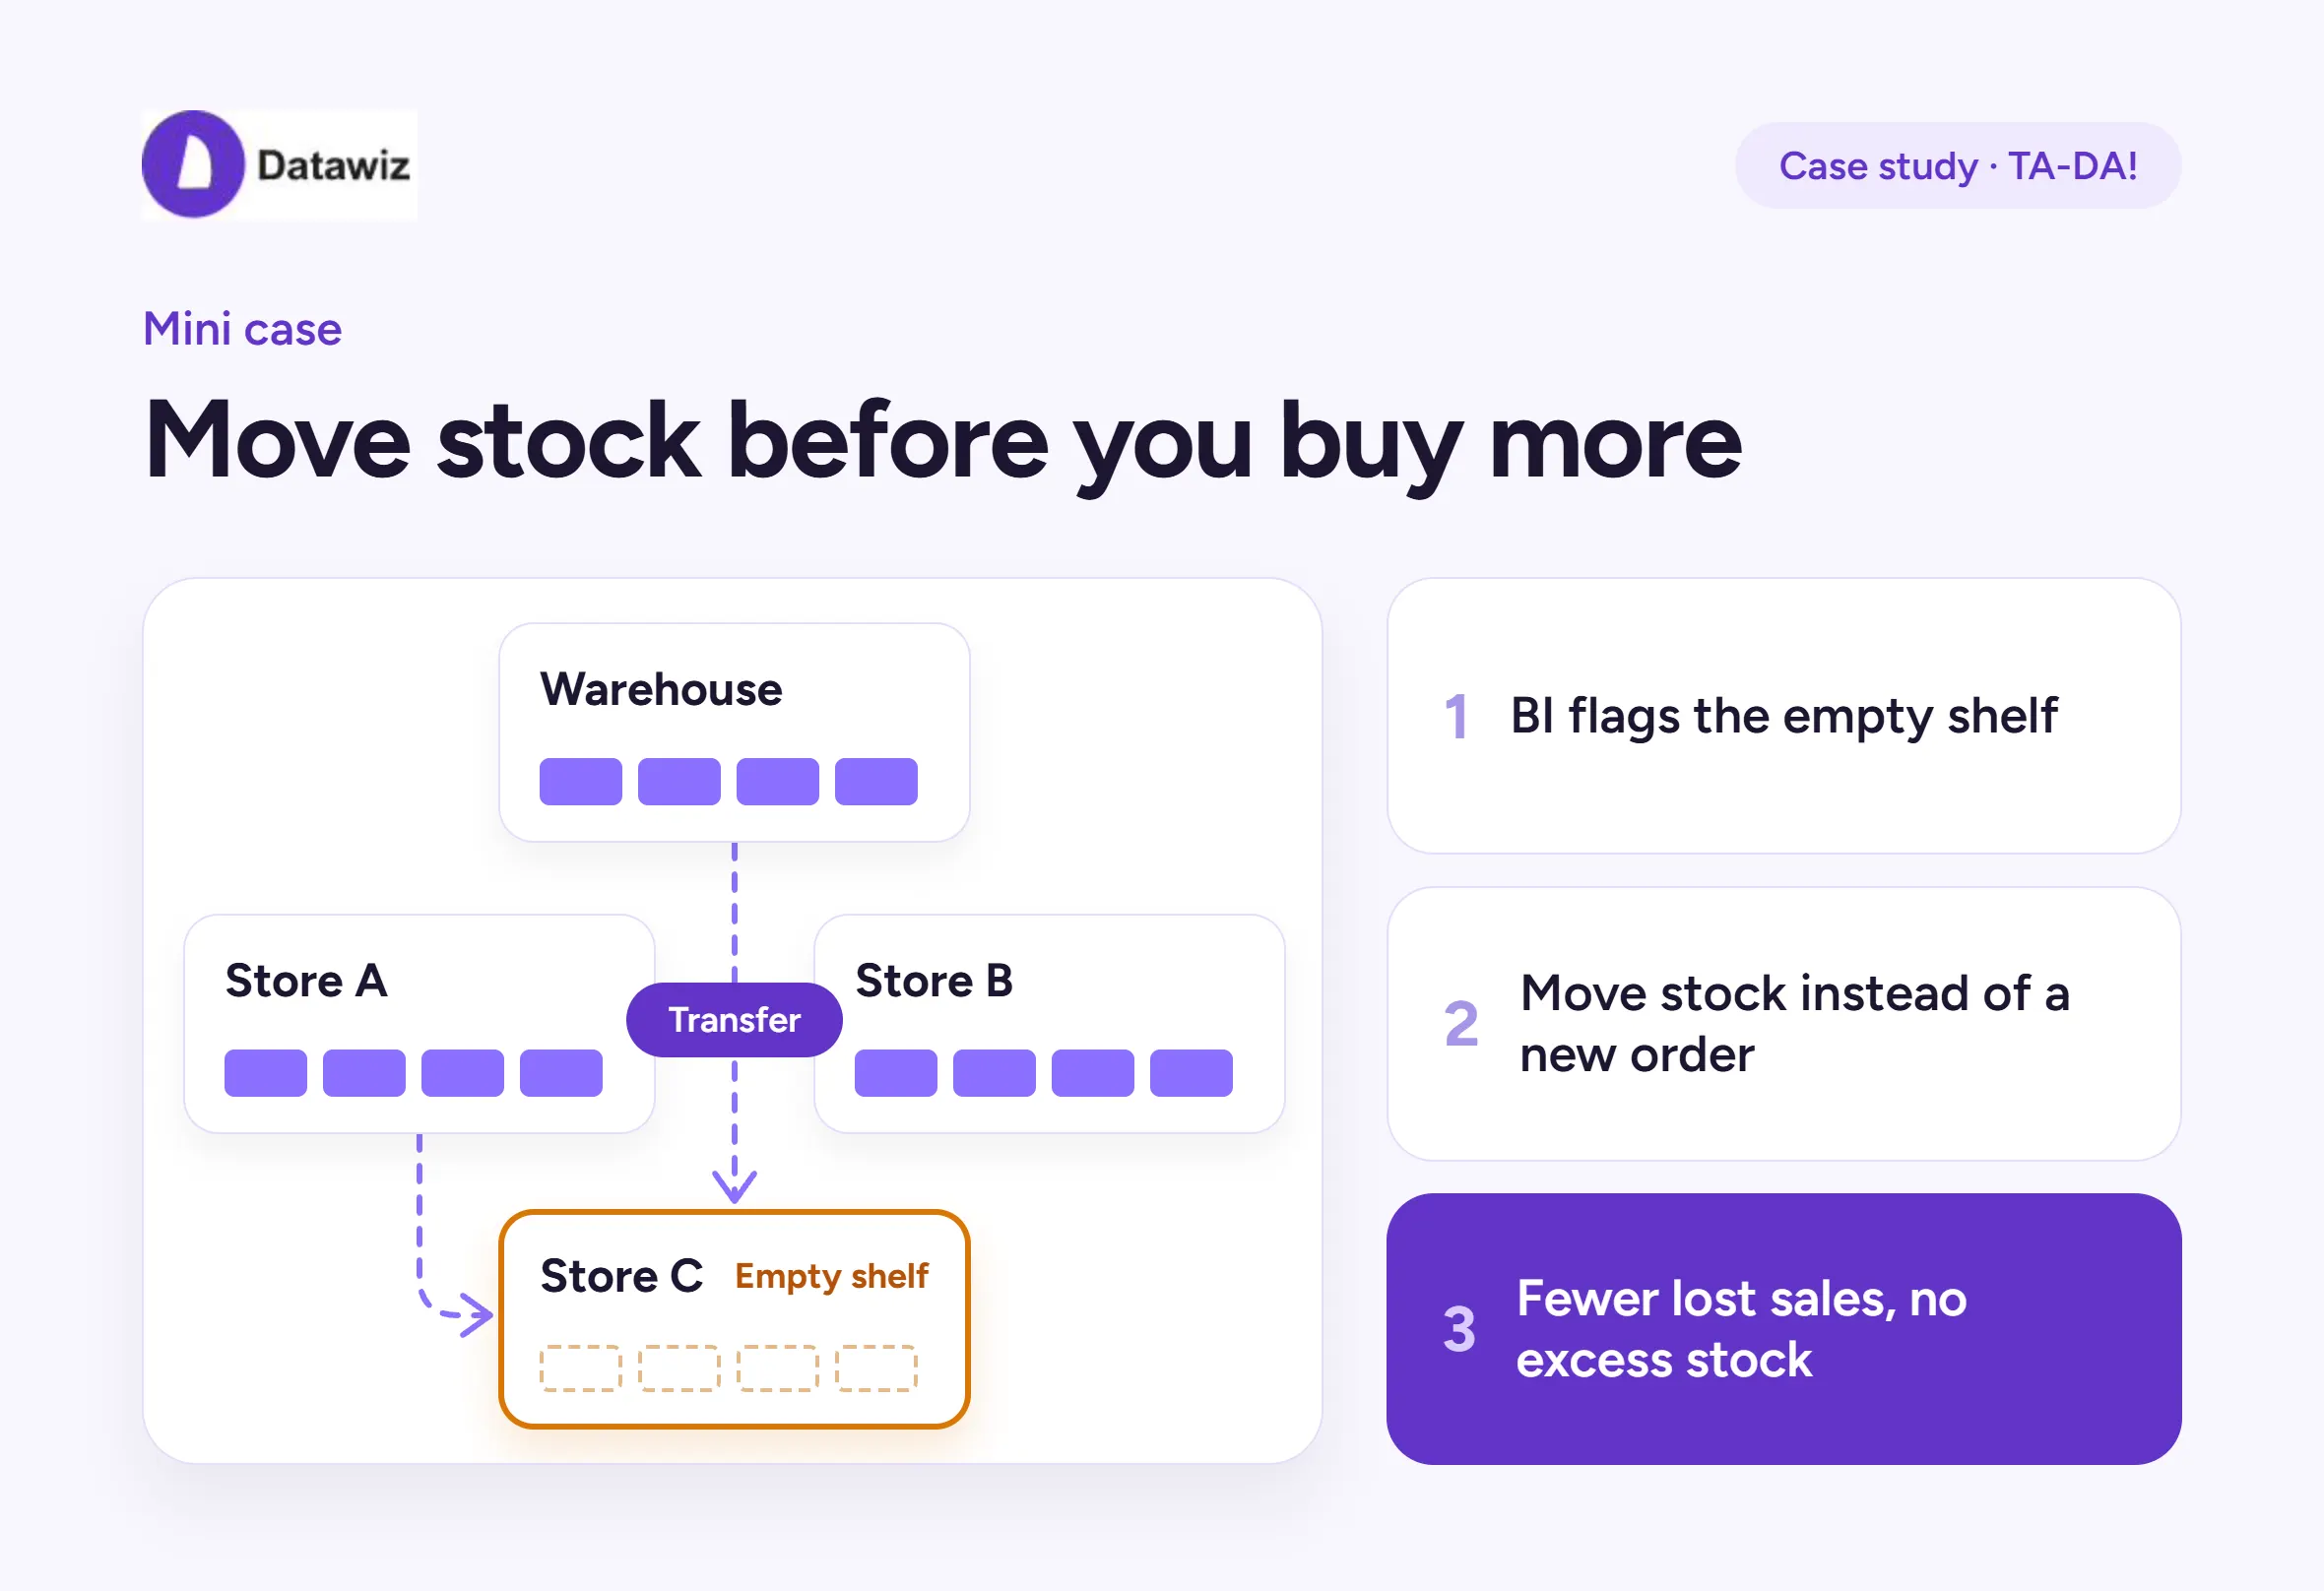
The problem: Across the chain, there’s enough of a product. But some stores have none on the shelf.
What Datawiz BI shows: It flags exactly these items: in stock somewhere in the chain, missing in a specific store.
What the team does: Instead of placing a new order, they first transfer stock from another store or the distribution center.
The result: Fewer lost sales, without adding excess inventory.
What changed at TA-DA! after switching to Datawiz BI
Faster answers
Checks that used to take several hours, sometimes a whole day, now often take 15–30 minutes. The team estimates that adds up to dozens of hours saved every week across the commercial department.
Tighter control over stock
The team now:
- catches stockouts and overstock sooner;
- keeps a closer eye on turnover;
- places more accurate orders;
- reacts to variances faster.
That shows up directly in product availability, sales, and how efficiently the chain uses its working capital.
Decisions backed by data
Less guesswork, less time spent chasing information. The team tests ideas against the data. Meetings are more focused: everyone can see the problem, how big it is, and what to do next.
Why no percentages?
TA-DA! doesn’t isolate the impact of Datawiz BI from other changes in the business. So the team chose not to put a number on sales or profit growth:
“We didn’t want to give an artificially precise percentage for sales or profit growth.”
What they can point to is operational and concrete: problems surface faster, and the team acts on them faster.
What the client says
“I’d recommend Datawiz BI to other retailers, especially chains with a large assortment and multiple stores. It brings key analytics together in one place, lets you drill down to the level you need quickly, and makes data an everyday working tool.”
— Nataliia Kolodna, Head of Commercial, TA-DA! supermarket chain

Make decisions based on real data with Datawiz BI




 No credit card required