 What's new?



Discount chain Kopiyochka moved its analytics from Excel to Datawiz BES. Now six departments calculate metrics the same way, key reports update without analysts touching them, and margin is visible at every stage of the product’s journey.
About Kopiyochka: a discounter where margin comes from thousands of SKUs
| Format | discount store for household and everyday goods |
|---|---|
| Stores | 500+, in almost every region of Ukraine |
| Datawiz BES solutions | Datawiz BI, Custom Formulas, Store Manager, Connector, PlanoHero |
In discount retail, profit per item is small, but there are thousands of items. The chain runs frequent short promotions and keeps growing its private labels and loyalty program. A mistake in margin or cost calculations doesn’t stay in one category here. It gets multiplied across hundreds of stores.
Before Datawiz BES: analytics in Excel and three problems that slowed decisions down
Vasyl Lozynskyi, Head of Strategic Analytics, Kopiyochka
For the business, that meant three things.
- Nobody fully trusted the numbers.
If the commercial and finance teams calculate margin differently, a decision on a purchase or promo has to wait until someone reconciles the data. And when the decision is urgent, it gets made without full confidence in the data.
- Expensive specialists were doing manual work.
An analyst spent an entire workday putting together a single inventory turnover report by hand. Every time the report was needed.
- More reports, more confusion.
Each department built its own spreadsheets and charts. Some reports duplicated each other, and it wasn’t always clear which one to go by.
What changed: before and after Datawiz BES
| Before Datawiz BES | With Datawiz BES | |
|---|---|---|
| Calculation method | each department had its own | one set of analytics for the whole chain, transparent to every department |
| Price and cost analysis | manual calculations in Excel | custom metrics in Custom Formulas: 6 types of price and cost within one category |
| Inventory turnover report | 6-8 hours of an analyst’s manual work every time | 1 hour to set up, then updates automatically |
| Number of reports | duplicates across departments | a structured set with no duplicates |
| How does the company work with data? | each department in its own files | 6 departments in one system |
Change 1. One calculation method: the same margin in every report
In Datawiz BI, each metric has one formula, and everyone can see it. When the commercial director and the finance team open a category report, they see the same margin, calculated the same way. No more reconciling files before a meeting.
The chain calls this one of the most valuable results:
For the business, trust in data means speed. Decisions on purchasing, pricing, or promotions get made right away, without a separate meeting to double-check the numbers.
Change 2. Custom Formulas: see exactly where the chain is losing margin
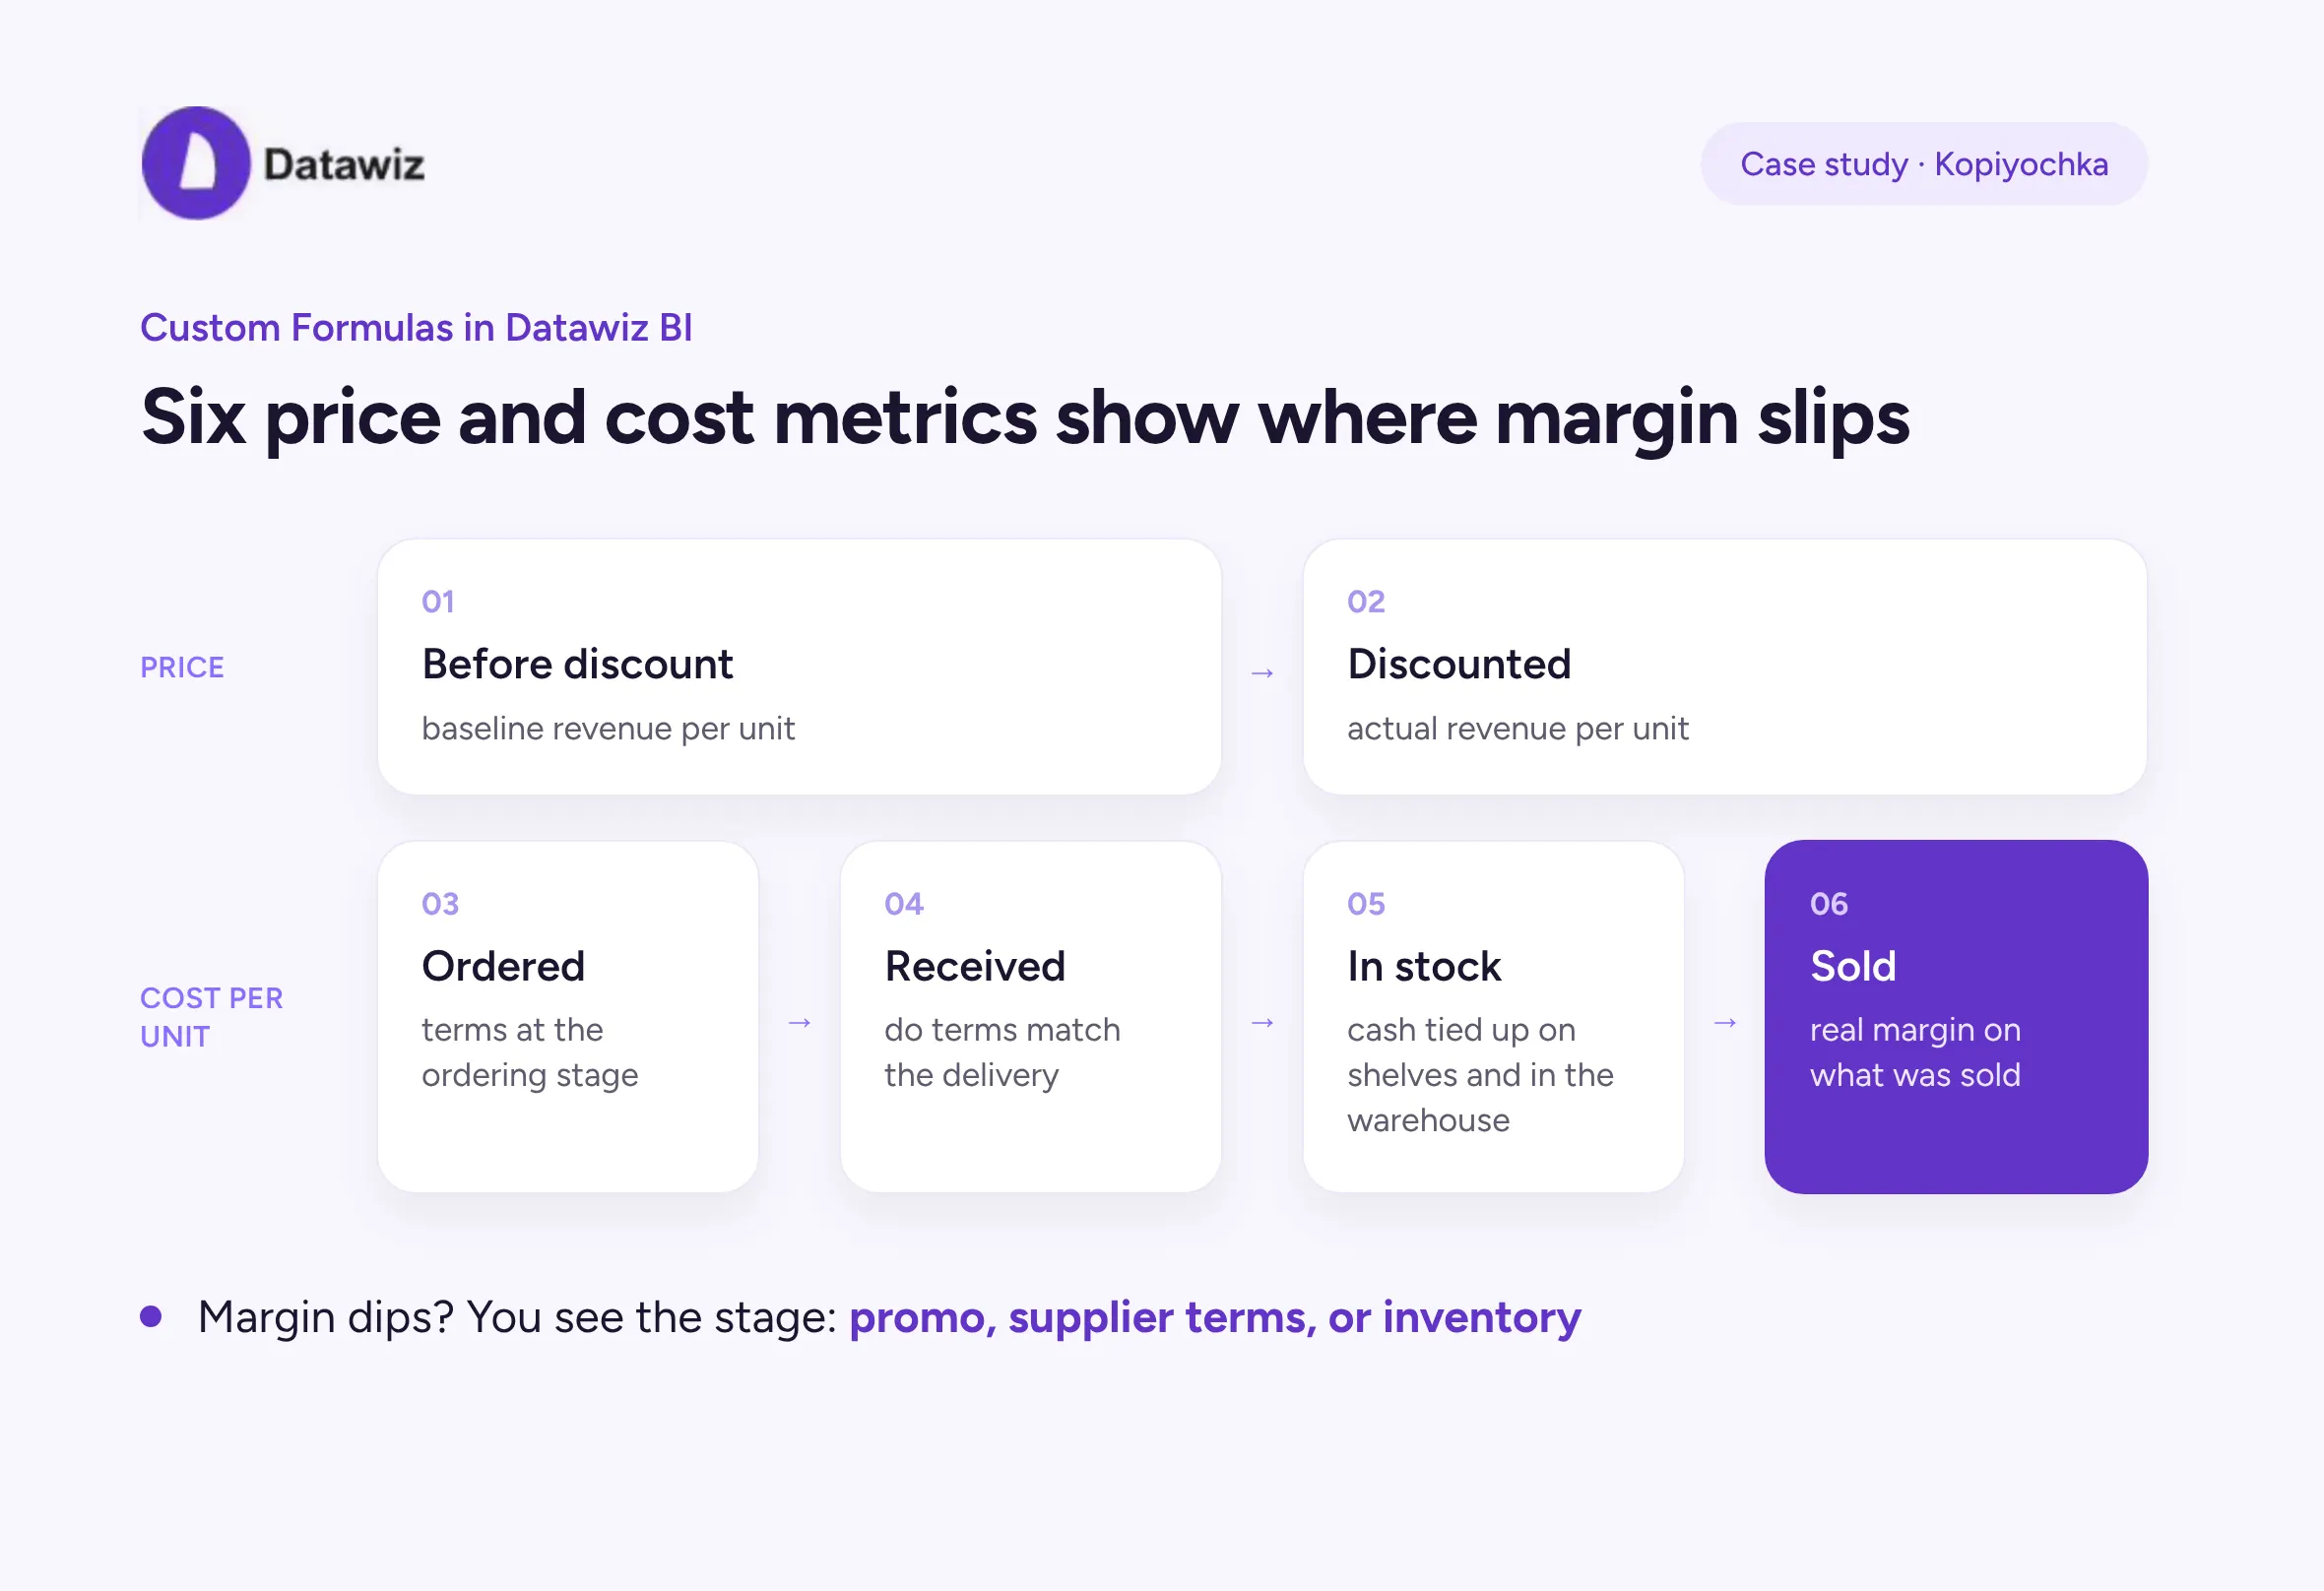
The team doesn’t stop at out-of-the-box metrics. In the Custom Formulas module, they build their own metrics to answer their own questions. For example, within a single product category they compare six types of price and cost:
- Custom Formulasis a Datawiz BI module where the team builds new metrics from existing ones using their own formulas and uses them in reports right away.
| Metric | What it shows |
|---|---|
| Price before discount | baseline revenue per unit |
| Discounted price | actual revenue per unit |
Cost per unit ordered | terms at the ordering stage |
| Cost per unit received | whether the terms match the actual delivery |
| Cost per unit in stock | how much cash is tied up on shelves and in the warehouse |
| Cost per unit sold | real margin on what was sold |
Together, these metrics show the product’s full path from order to sale. If a category’s margin dips, you can see at which stage: the promo, supplier terms, or inventory. For a chain with regular promos and private labels, this is a direct way to keep profit under control.
Change 3. Automated reporting
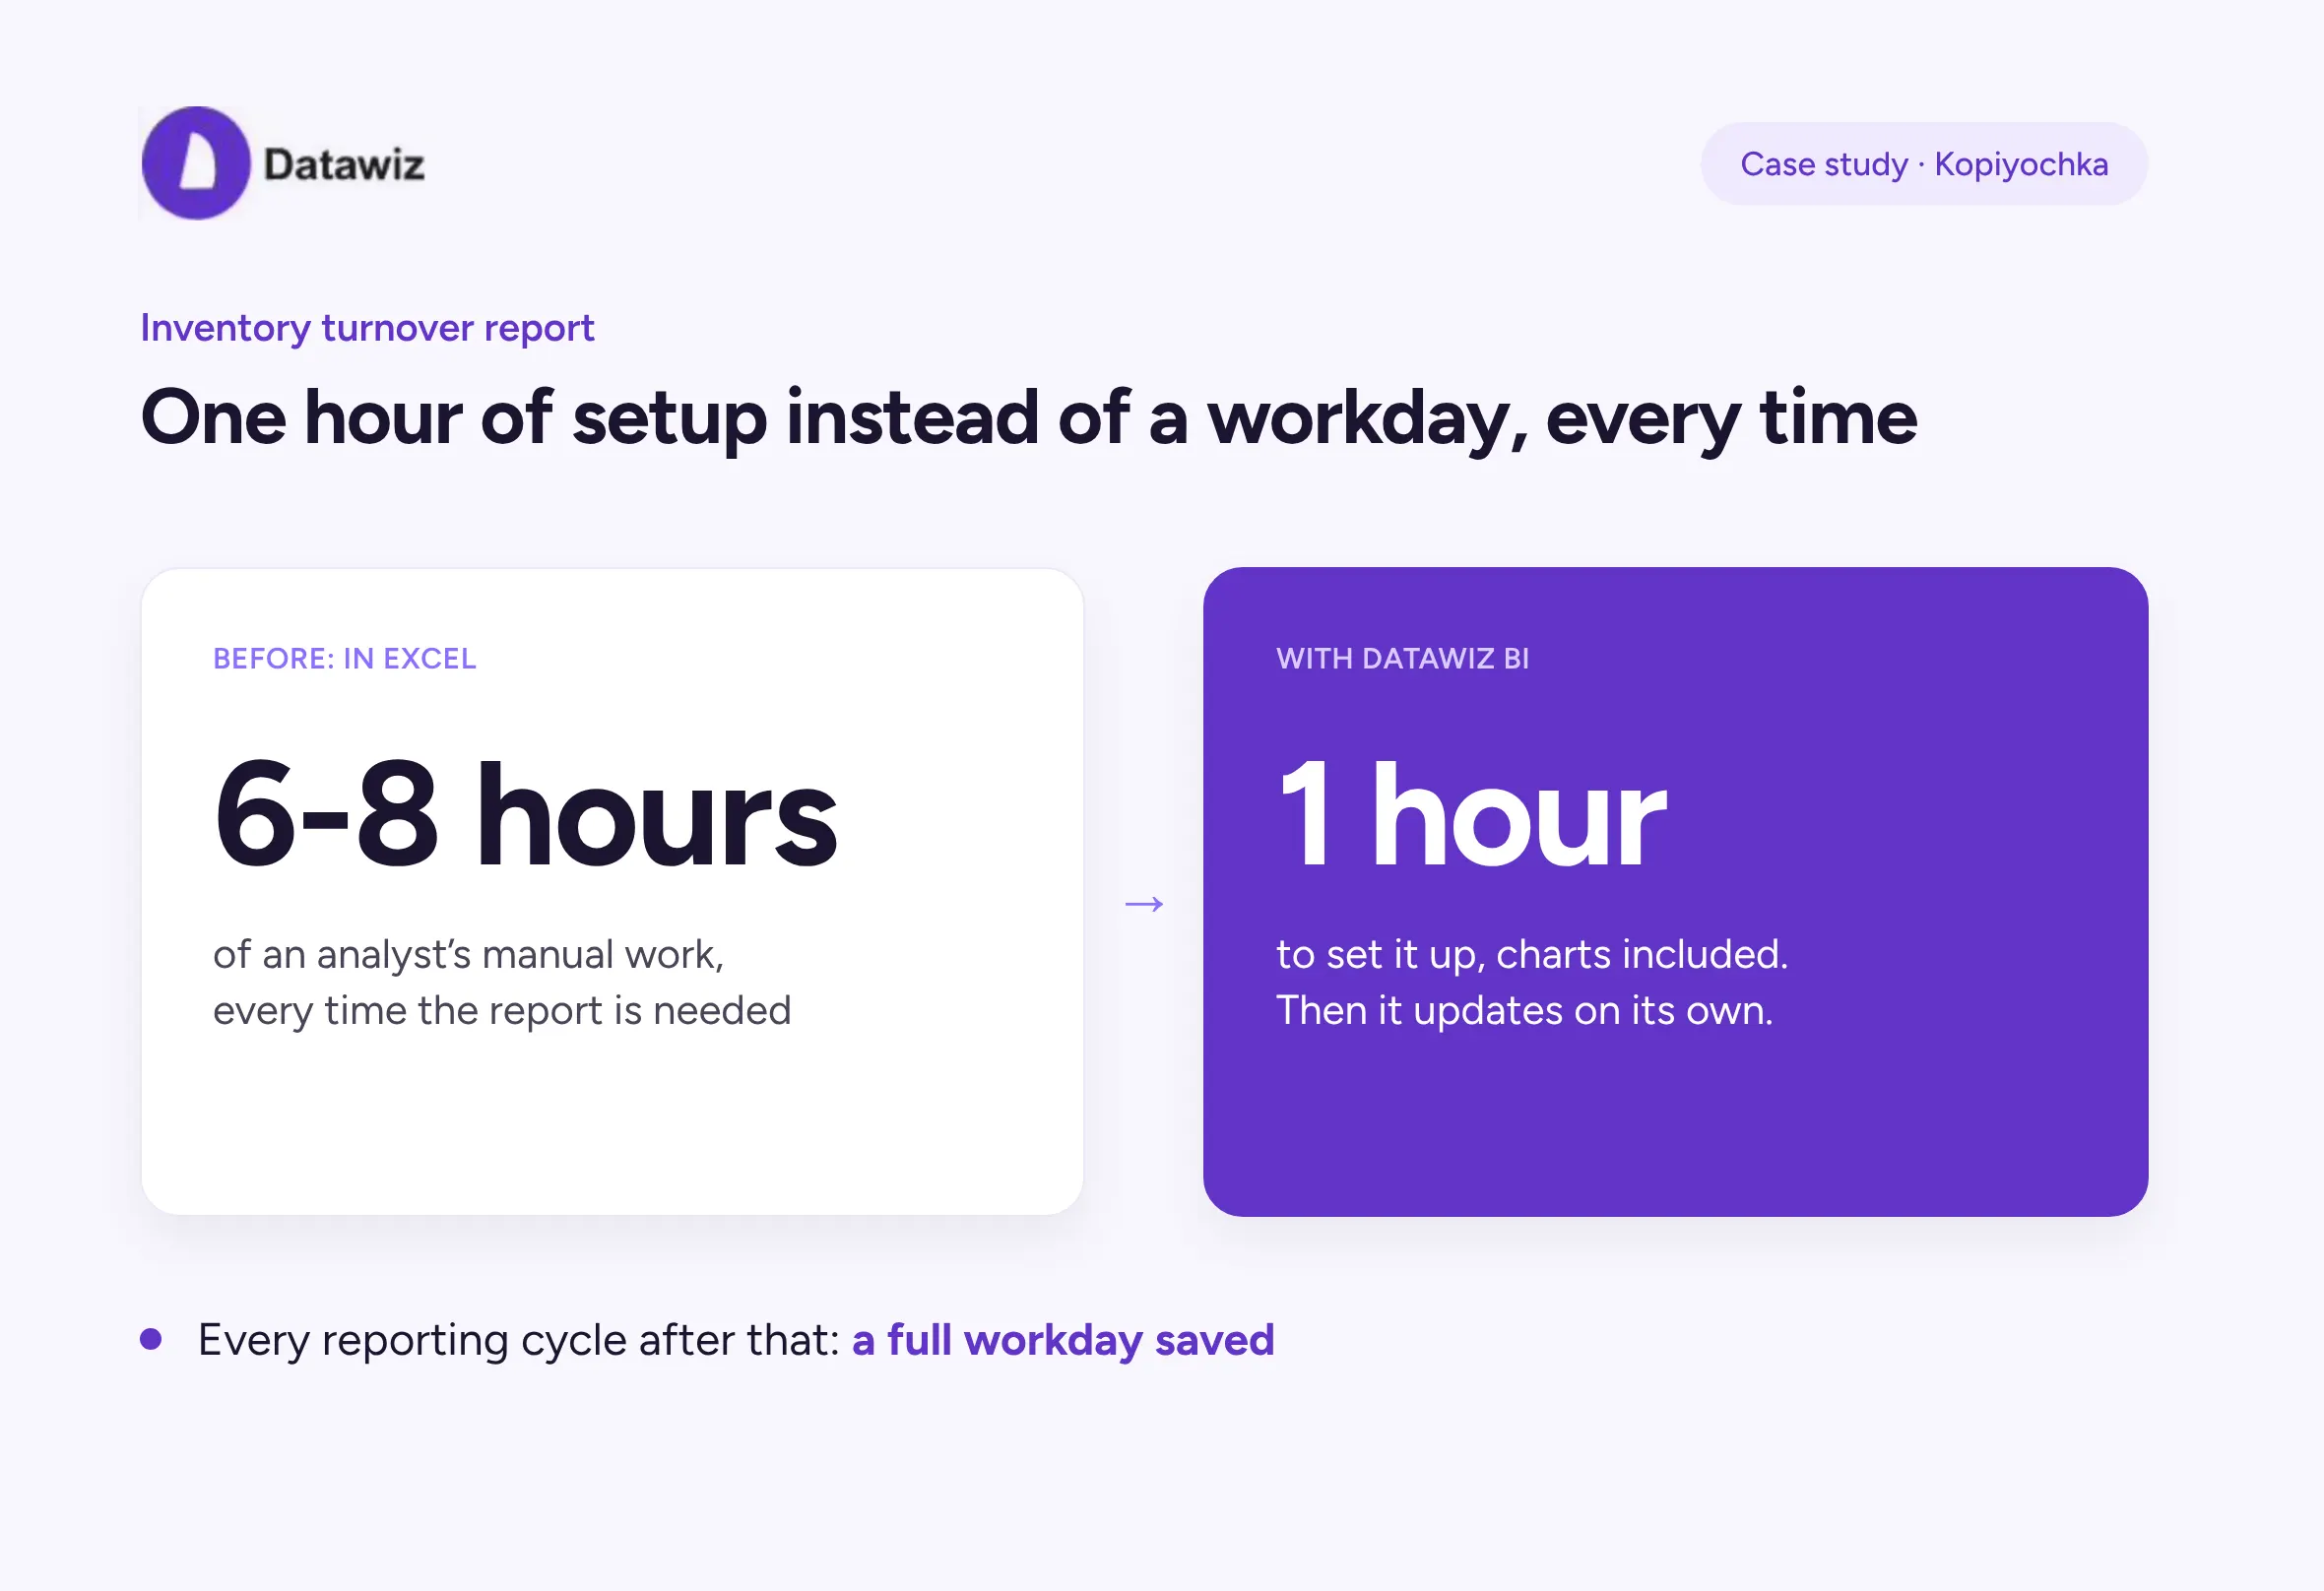
The inventory turnover report by category used to take an analyst 6-8 hours. In Datawiz BI, the team set it up, charts included, in 1 hour. From there, the report updates on its own. Every reporting cycle after that saves a specialist a full workday.
At the same time, the chain cleaned up its reporting. Reports were organized, duplicates removed, and the total number went down. With fewer reports, it’s easier not to get lost in the numbers.
The time that used to go into pulling data together now goes into working with it:
Change 4. Six departments in one system: from assortment to checkout
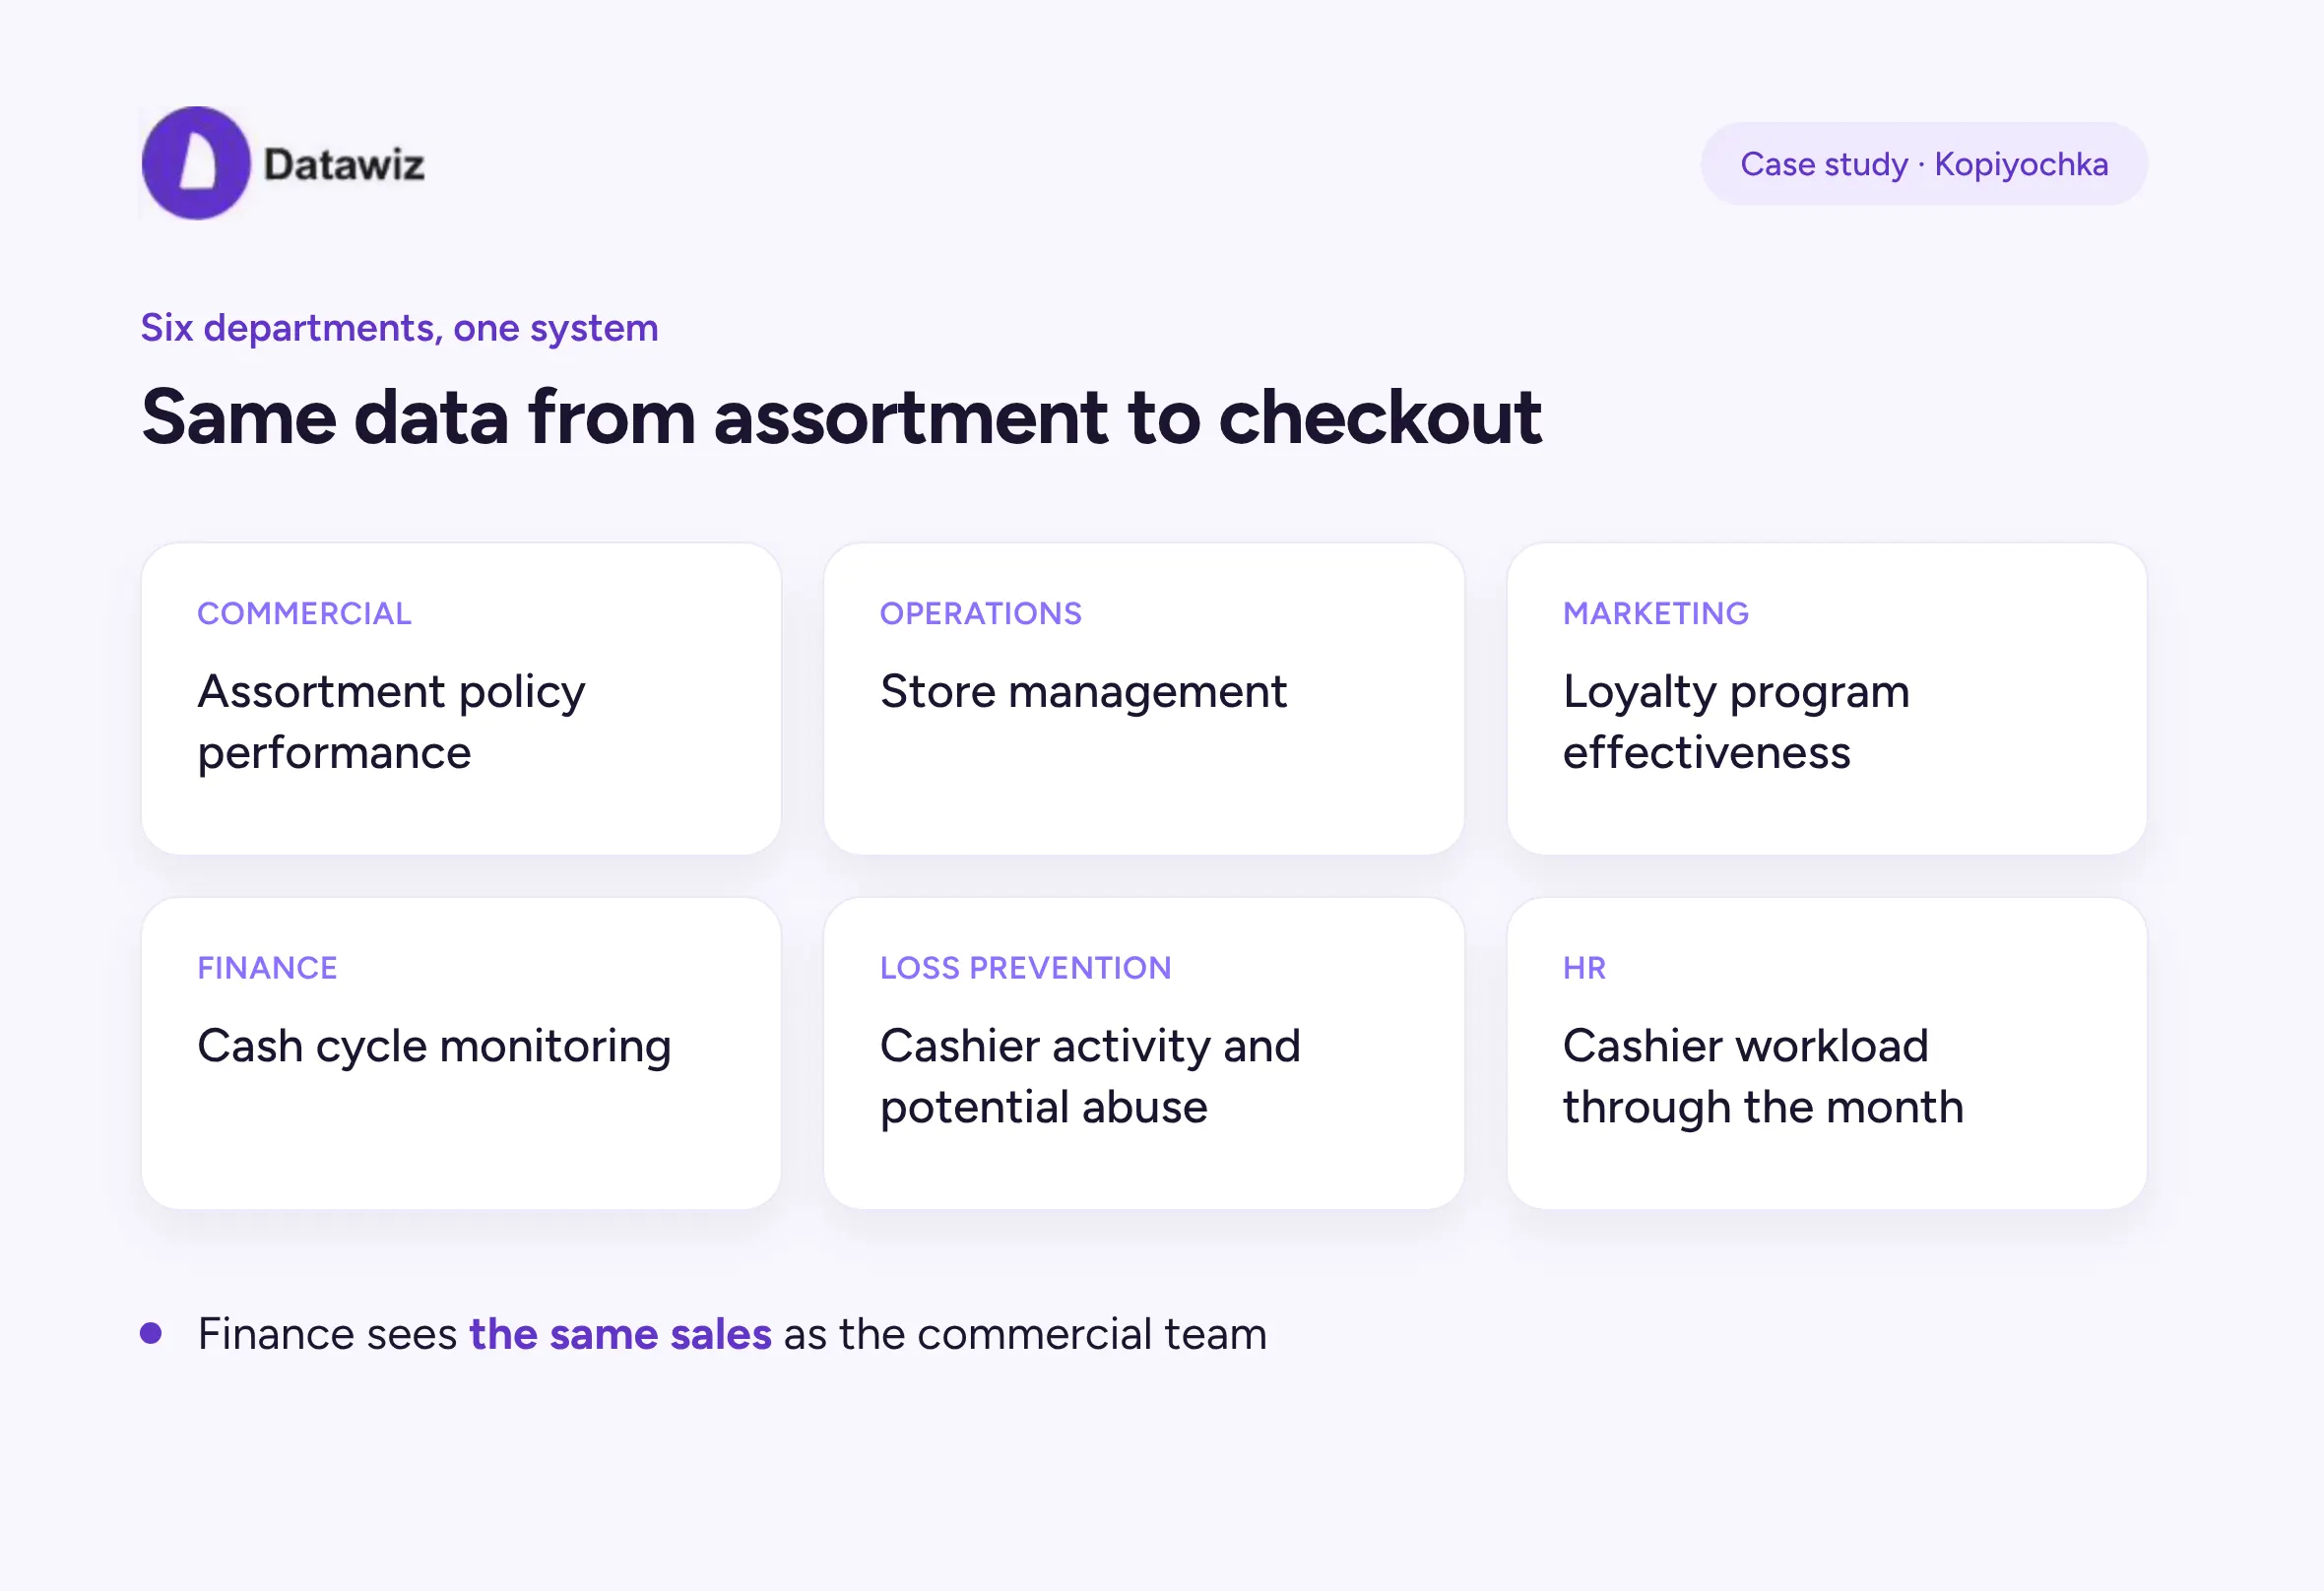
At Kopiyochka, Datawiz BES isn’t just for analysts. Each department handles its own tasks, but on the same data.
| Department | Task in Datawiz BES | What it means for the business |
|---|---|---|
| Commercial | assortment policy performance | money goes into categories that actually earn |
| Operations | store management | one consistent standard across 500 stores |
| Marketing | effectiveness of customer engagement through the loyalty program | the bonus budget drives repeat purchases |
| Finance | monitoring and evaluating the cash cycle | visibility into how much cash is tied up in working capital |
| Loss Prevention | cashier performance analysis, spotting potential abuse | fewer hidden losses at the register |
| HR | cashier workload throughout the month | staff schedules that match real workload |
When all departments work in one system, data from one task is immediately available for another. Finance sees the same sales as the commercial team, and loss prevention and HR look at the same cashier activity from different angles.
Business results: faster decisions and control over profit
- Decisions without reconciling numbers. Every department uses the same methodology, so conversations about purchasing, pricing, and promos focus on substance, not on whose file is right.
- A full analyst workday saved on every report. A report that used to take 6-8 hours was set up in an hour and now updates on its own. The time freed up goes into finding the causes of deviations and preparing recommendations for leadership.
- Margin under control at every stage. Custom Formulas show exactly where profit slips away: in promos, supplier terms, or inventory.
- Fewer hidden losses. Loss prevention spots anomalies in cashier activity, and HR plans schedules around actual workload.
The chain sums it up like this:
Vasyl Lozynskyi, Head of Strategic Analytics, Kopiyochka
And on working with the Datawiz team:
Analytics and the shelf in one ecosystem: Kopiyochka’s PlanoHero case
Alongside Datawiz BI, the chain manages its shelves in PlanoHero. The results there are hard numbers: the assortment was cut by about 10%, and revenue per store grew by 8-12%. Read how they did it in the PlanoHero case study.

Make decisions based on real data with Datawiz BI




 No credit card required