 What's new?
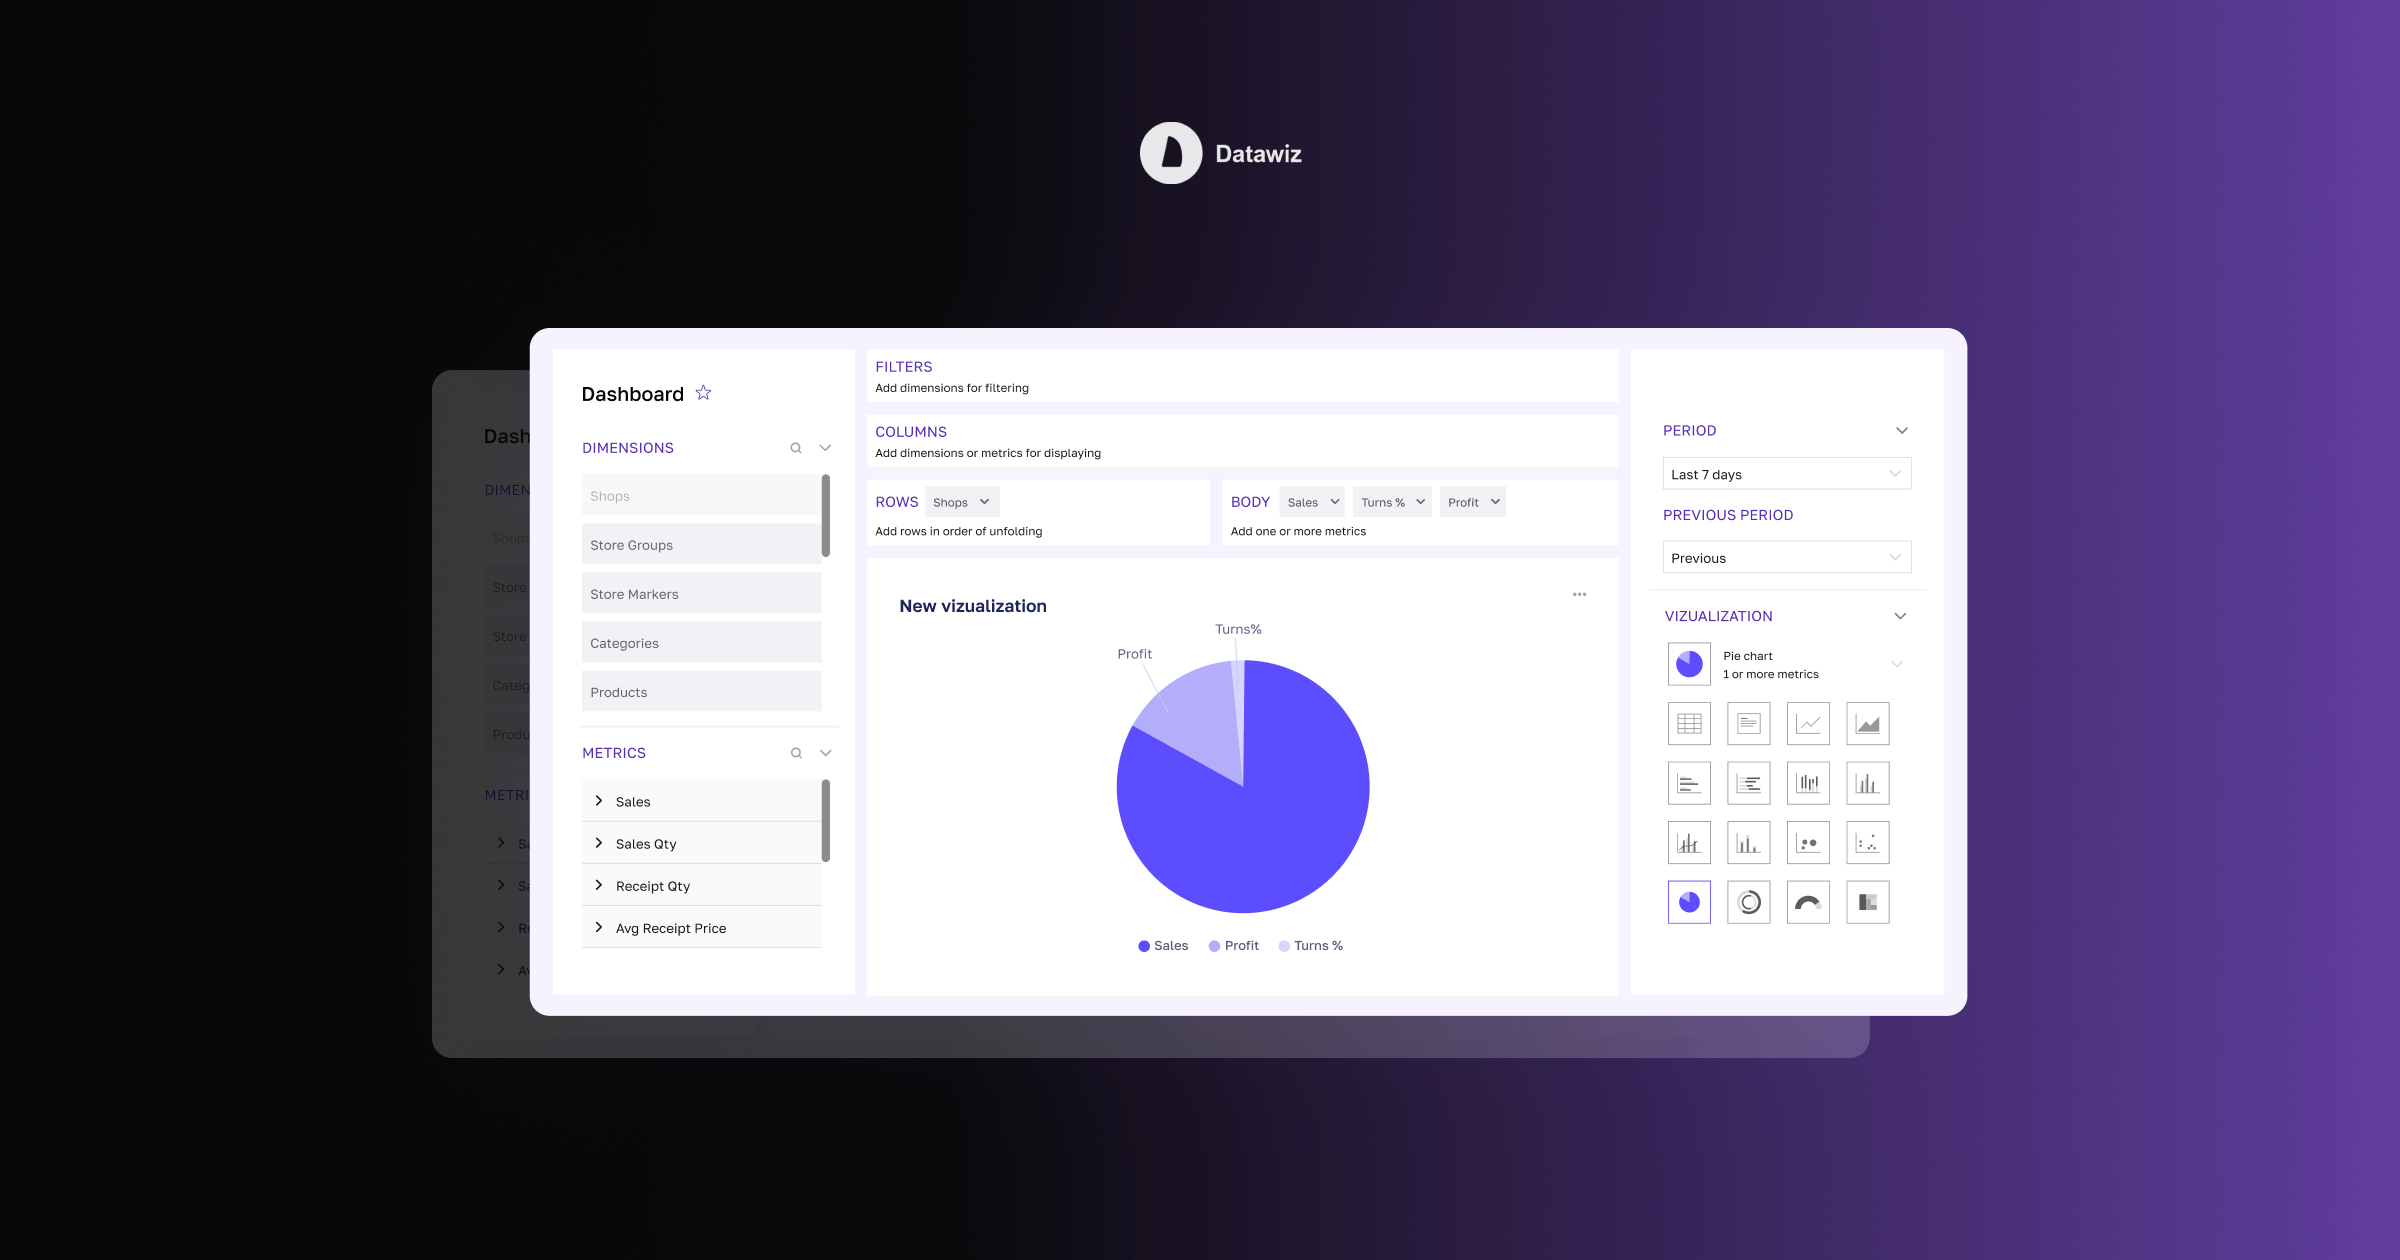

Table of contents:
It's no secret that retail business is constantly developing and scaling under the influence of various factors: data visualization tools, artificial intelligence-based analytics in retail, and market trends. The best BI tools provide retailers with fast and high-quality analytics for the store, as well as optimize retail data to generate insights. In such an environment, where the amount of analytical information and competition is growing every day, understanding key aspects of business processes and making informed decisions based on data becomes a key task. Thus, an important data visualization tool – BI dashboards – comes to the fore.
What are BI dashboards?
A dashboard that is essentially a constructor of formulas, charts, and graphs. It guarantees dynamic and intuitive visualization in retail and allows you to analyze data in real time. Moreover, there is no need to waste time and effort – BI dashboards guarantee to get insights from retail data in the shortest possible time.
The builder allows you to visually present the necessary data that reflects the general state of the chain, patterns or inaccuracies and helps in decision-making.The process of data visualization in retail is a powerful BI tool for every retailer.
The difference between retail tools: BI dashboards and reports
The primary purpose of dashboards as a Business Intelligence solution is to help users make quick decisions. In this context, a visualization builder provides faster information in an understandable format than reports:
- BI dashboards contain visual information that is easier for us to evaluate. Instead of a lot of numbers, they are based on graphical data.
- Any visual data tool guarantees information extraction. All data is displayed on the main panel (graph, chart, etc.).
- Usually, BI dashboards can be sent to colleagues. Other users do not need to flip through pages of reports: all the essential information is already visible and, most importantly, understandable on the visualization.
- The display level of visual data tools allows you to move from general information to the most minor details. This speeds up the optimization of retail data.
Visualization opportunities in retail
Considering all the above, it may seem that a BI dashboard is the best solution for data analytics. Creating online dashboards is a complicated process, but it is extremely important for business analytics. With the right choice of graphical tools and visualization types, the analysis process will become quite effective. Depending on your data, the dashboard builder will allow you to create various graphical methods: graphs, charts, diagrams, tables, etc.
BI dashboards have a number of advantages that make it hard to imagine the best data analytics solution without them and are worth telling you about:
- Quick access to information:the ability to quickly get insights in the retail sector without having to go into the details of analyzing large amounts of information.
- Optimization of retail data: graphs, charts, and other visual elements make complex data easier to understand and allow for effective decision-making.
- Visualization in retail:BI dashboards provide graphical visualization of a large amount of data, which makes it easier to understand and analyze.
- Collaboration and team engagement:Data visualization tools provide communication for collaboration, allowing different departments and teams to work with shared data, metrics, and other visuals.
- Personalization and customization: BI dashboards are customizable to meet the specific needs of the chain, providing insights for decision-making.
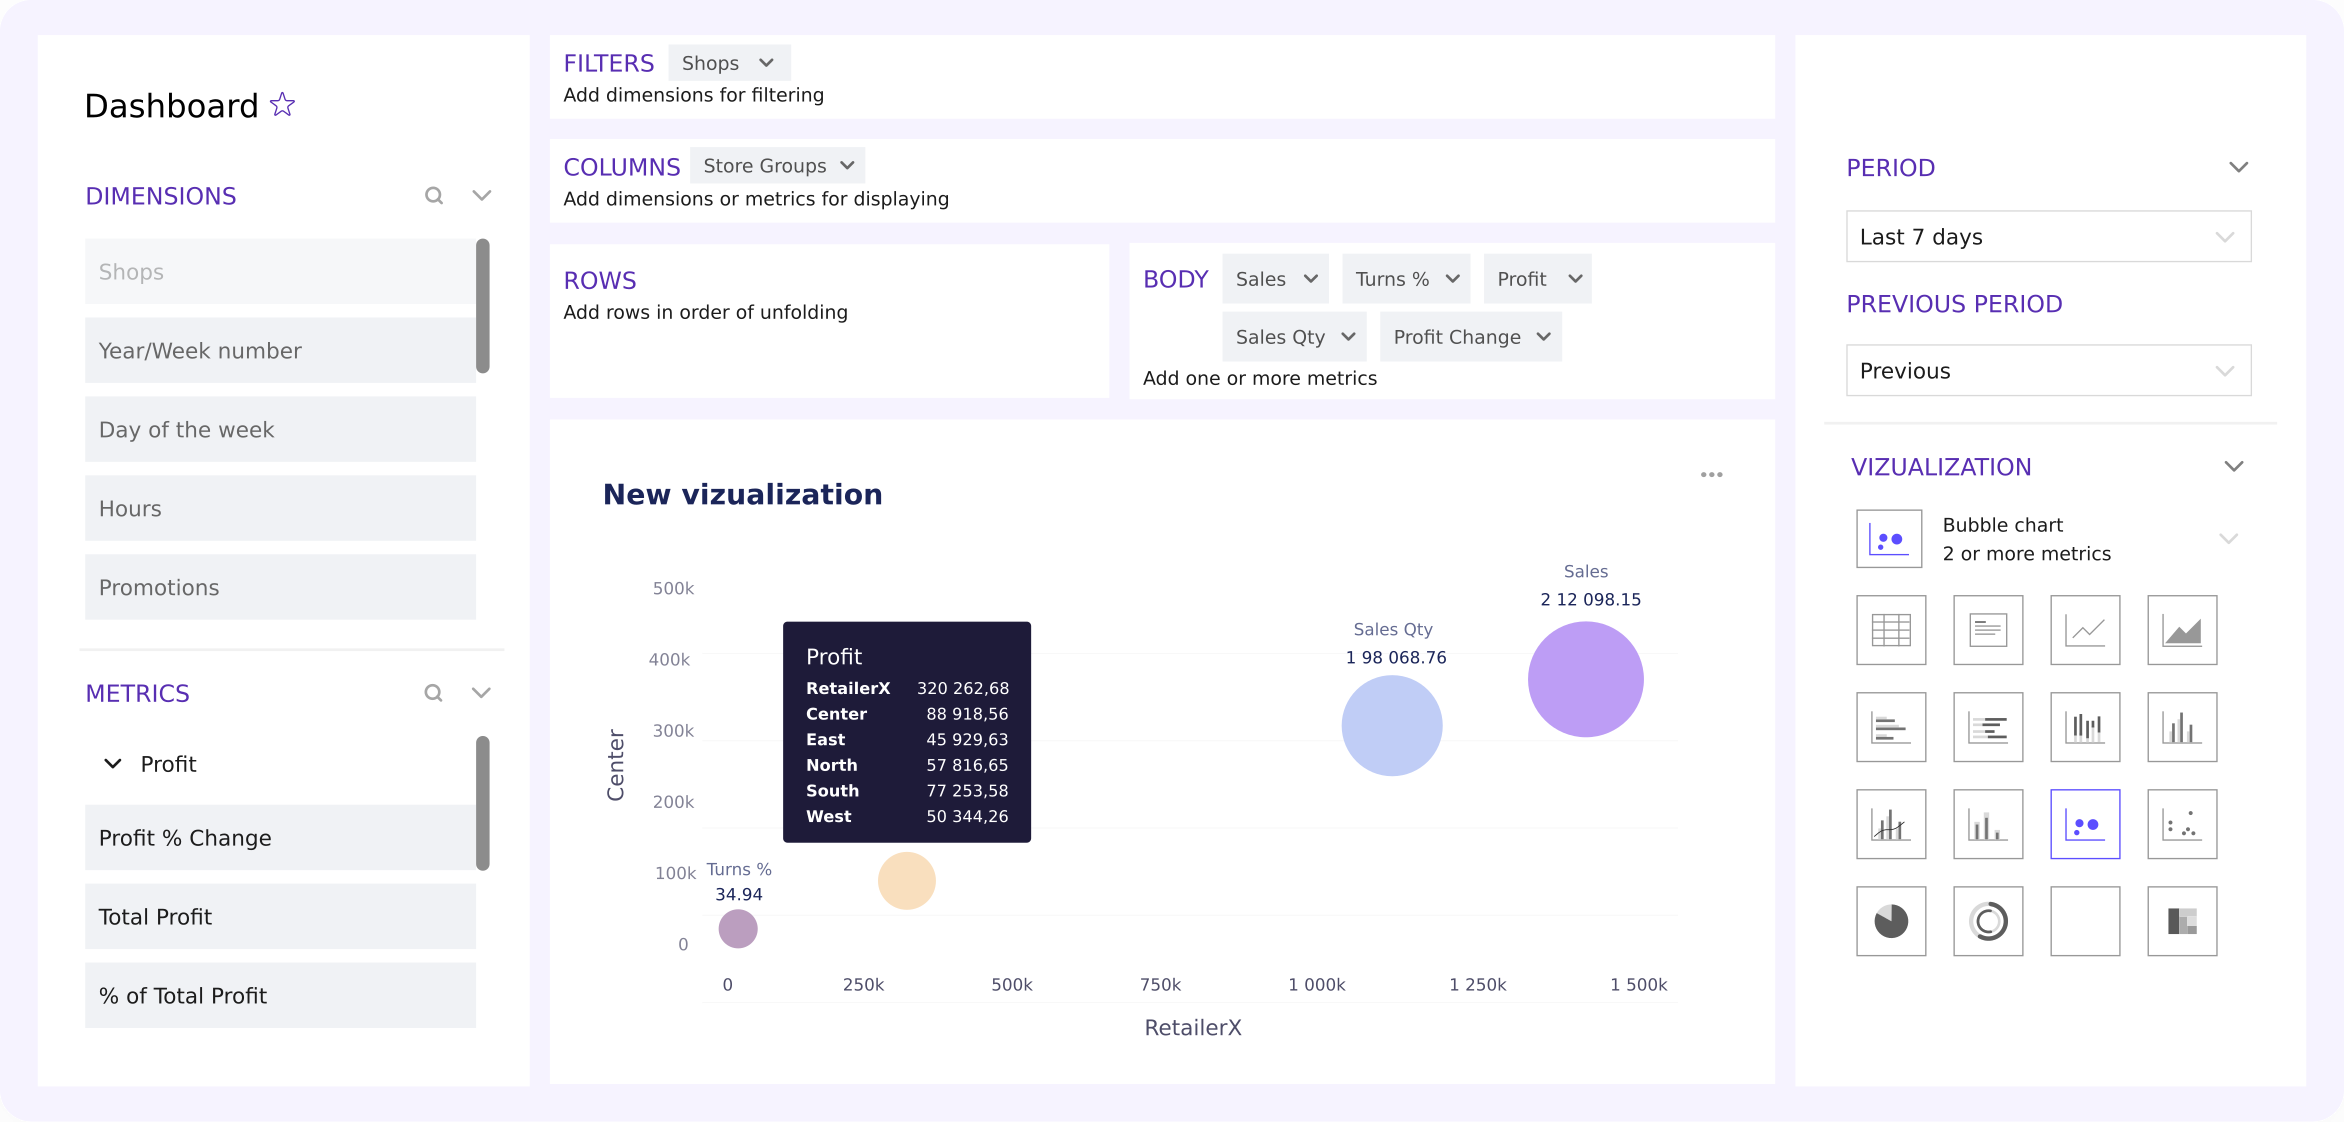
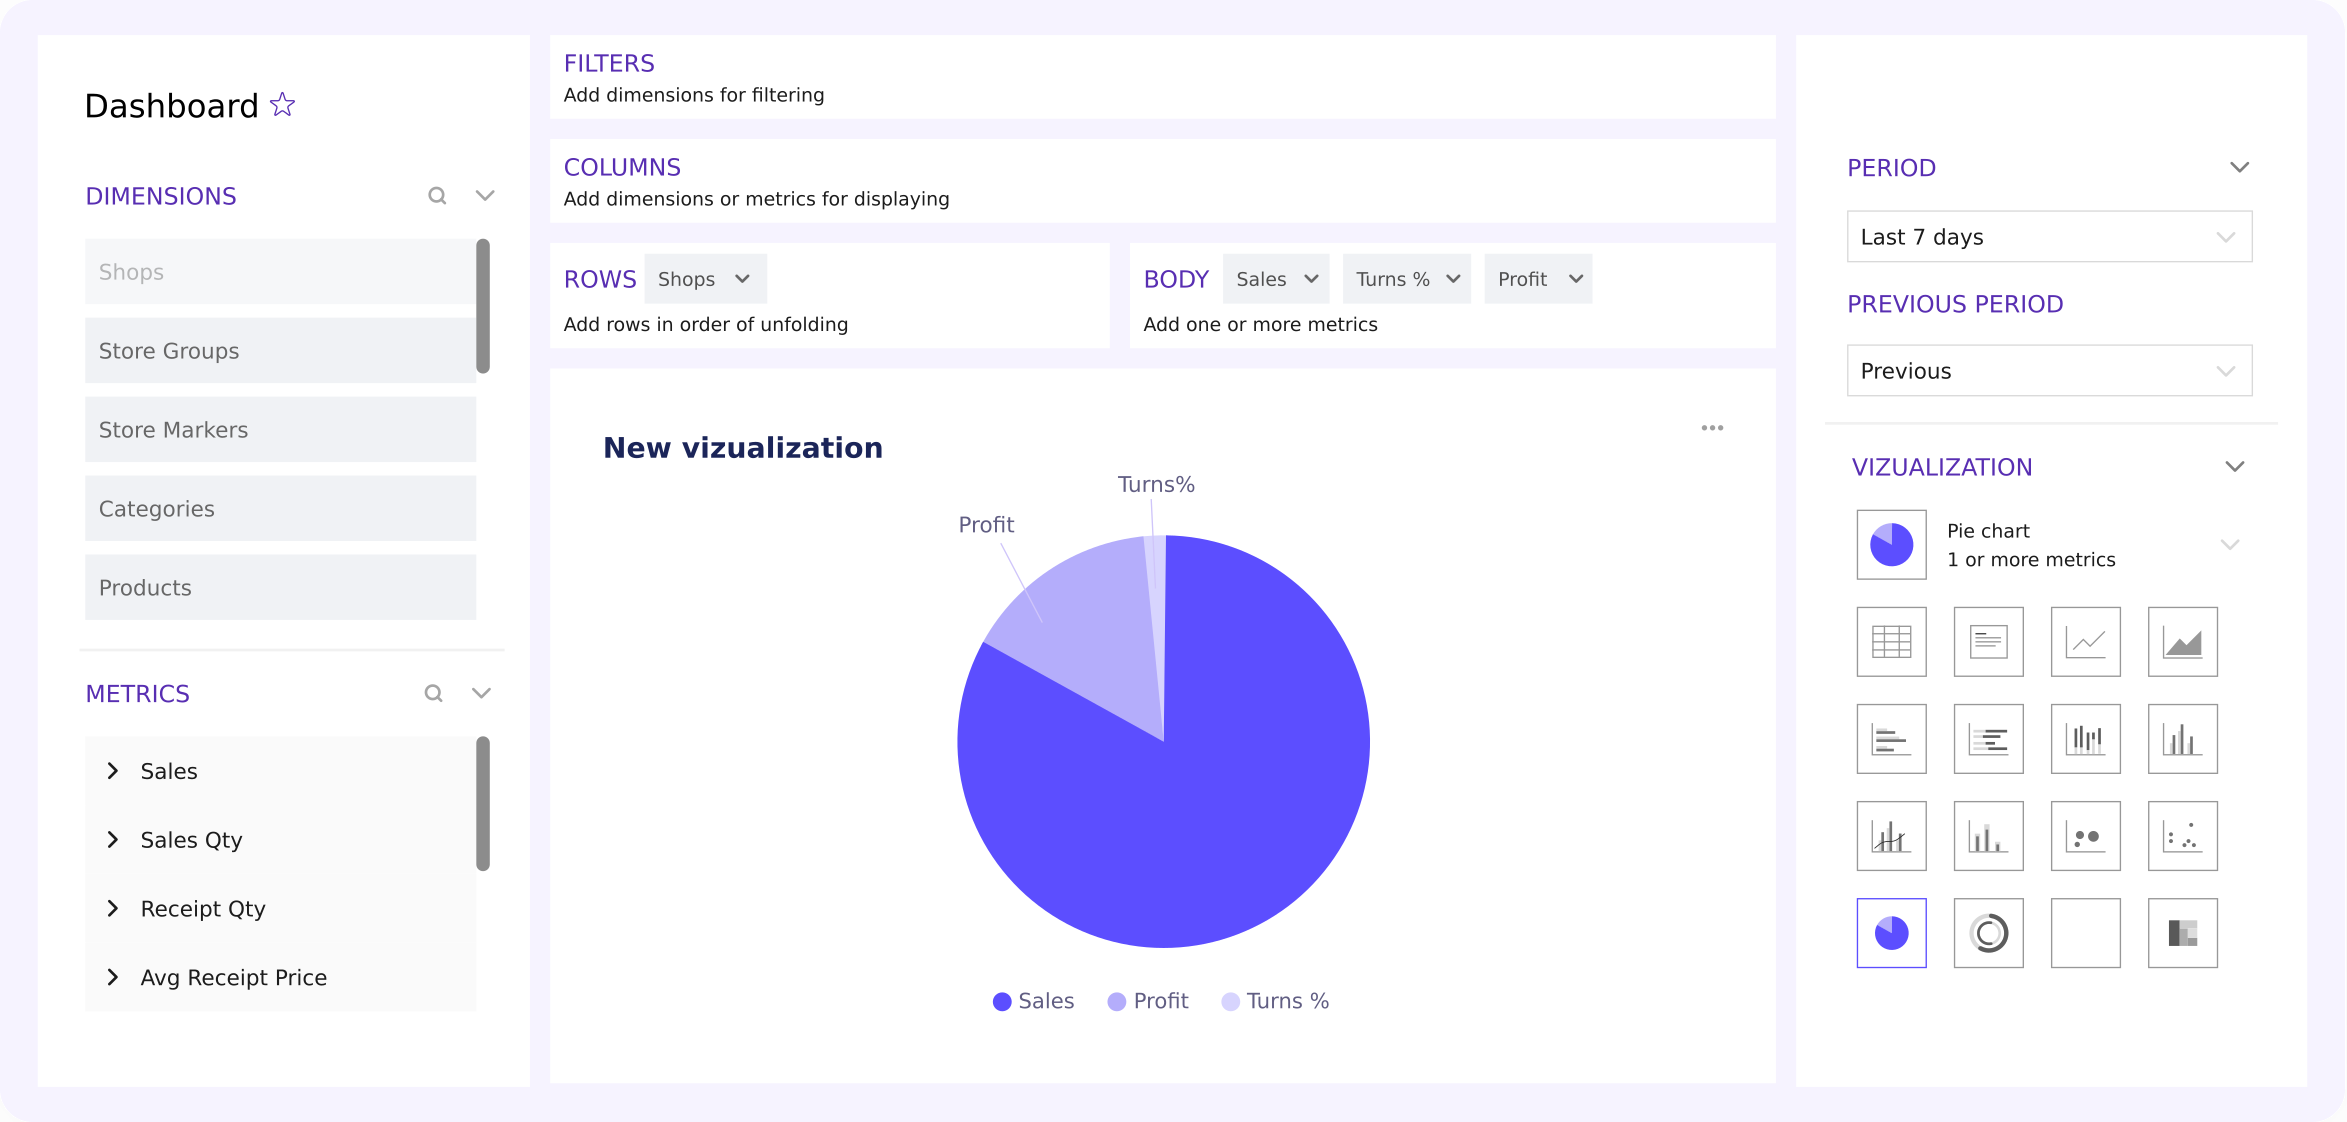
Dashboards Builder
Our team understands the importance of using up-to-date BI systems for retail, so we are constantly improving our data visualization tool – Dashboards Builder. Using all possible means of improvement (data visualization tools, analytics based on AI technologies in retail and market trends, etc.), we are constantly adapting to the challenges in the retail industry:
- Effective presentations: create visualizations based on 17 different ready-made display options.
- Intuitive interface: create interactive BI dashboards with a straightforward interface and drag-n-drop technology.
- Flexible settings: the visualization builder allows you to customize indicators to your needs. Combine, use different sections, and compare.
- Quick communication: the ability to share created visual dashboards with colleagues and platform users.
Conclusion
Many chains recognize and use dashboards to increase their competitiveness. The ability to visualize and analyze data in real-time, collaborate on information, and customize flexibility within one BI system make visualization in retail an effective and high-quality solution. Using a data visualization designer allows you to harness the potential of a large amount of data. Instead of the traditional analysis method using complex reports, dashboards enable users to interact with information through graphical elements such as graphs, charts, and maps.
These aspects make BI dashboards a powerful data visualization tool for gaining insights into the retail industry. They ensure effective optimization of retail data, leaving time for making informed strategic decisions.


 No credit card required