PRICE RECOMMENDATIONS
Laboratory - AI-based reports module on Datawiz BI service
The Price recommendations report contains two tabs: Price Recommendations and Accepted recommendations.
Price recommendations
The "Price recommendations" tab allows to view a list of recommendations with predicted sales increases and accept the recommended optimal price for the product.
The tab allows:
- to identify products for which it is recommended to change prices in individual stores of the chain, and choose the most effective pricing policy;
- to track the relationship between price changes and profits for selected products on the visualizations;
- forecast sales metrics based on the optimal price.
The algorithm determines the price elasticity of demand and, on its basis, forms the optimal price. That is, it determines the dependence of the price and the number of sales during the year. Next, it calculates the profit for each possible price. The price that generates the biggest profit is displayed as the optimal price.

At the top there are information cards with metrics that show the number of products and stores with recommendations and predicted changes in sales per day, namely:
- Increase in sales per day
- Increase in profit per day
- Increase in sales qty per day
- Number of products for which recommendations were found
- Number of stores for which recommendations were found
Below there is a table showing products and stores with current and predicted sales metrics based on current and optimal prices.
The recommended optimal price can be accepted in the table.
After accepting the recommendation the product is moved to the "Accepted recommendations" tab.
Accepted recommendations
The "Accepted recommendations" tab allows to view the list of accepted recommendations and track changes in sales of these products.
Note! You can track the change in sales according to the accepted recommendation starting the next day after uploading the data to the service.
The report table can include "-" or "0" just after the recommendation is accepted.
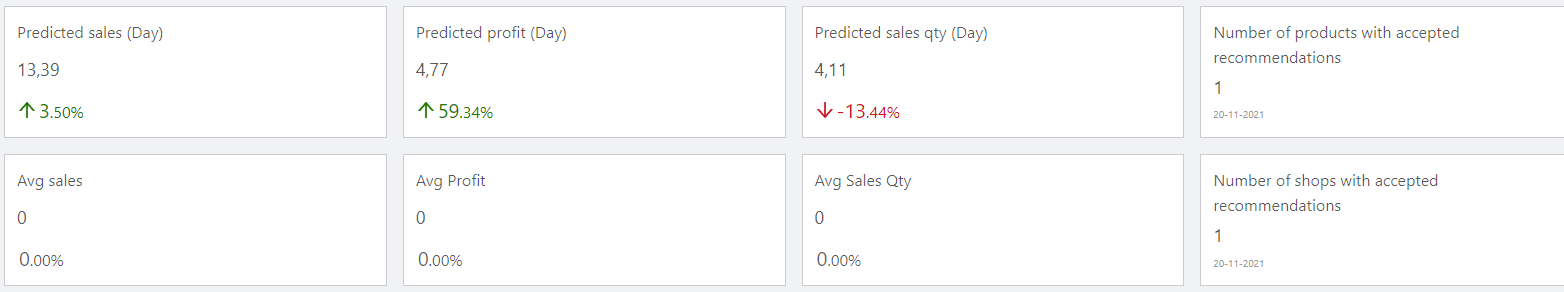
At the top there are information cards with metrics that show total and average qty of products and stores with recommendations and predicted changes in sales per day, namely:
- Predicted sales (Day)
- Predicted Profit (Day)
- Predicted sales qty (Day)
- Number of products with accepted recommendations
- Avg sales
- Avg Profit
- Avg Sales Qty
- Number of stores with accepted recommendations
Below is a table that allows to see how change in price affects sales, profit and sales qty.
The recommendation can be canceled.
Evaluation of reports
The main goal of creating the "Laboratory" section is to get feedback (rating and/or recommendations) from users and improve new reports according to the current needs of retailers.
Here is a column "Please evaluate the forecast" for each product/store in the experimental reports. It contains two buttons:
-
Like - a click paints the button and indicates that the forecast is realistic and the user likes it;
-
Dislike - a click paints the button and indicates that the user has doubts about the accuracy of the forecast.
Clicking on any evaluation button opens a window, where the user can leave a comment or recommendation to improve the calculation.
Your expertise will help us get better.
Metrics
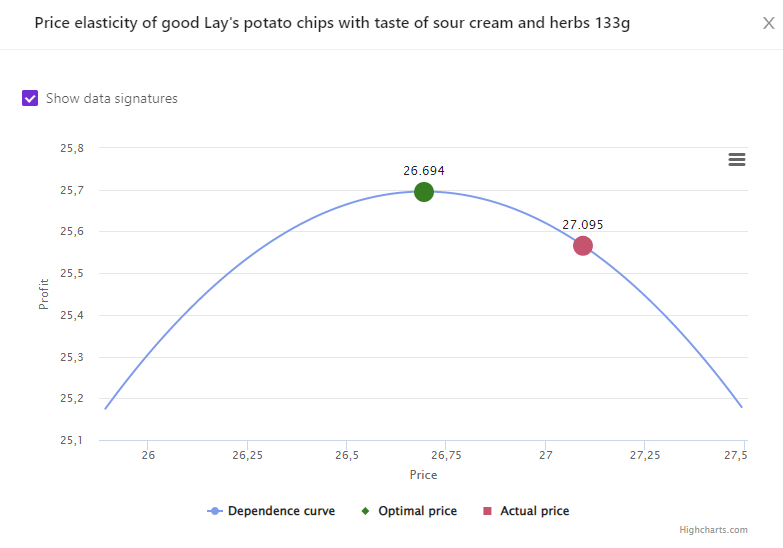
The "Price" metric which is highlighted in purple for the lower level is clickable. Clicking on it opens a window with a graph of the price elasticity of the product which contains: The curve of profit versus product price, Current price and Optimal price. Moving the mouse along the curve you can see what amount of the profit and sales qty will be at the appropriate price.
Optimal price - the price, which will bring to store the largest amount of profit of this product.
All metrics are divided into subgroups:
Sales
Sales Qty
Profit
Price
Availability
Assortment activity
Laboratory
- Please rate the forecast
- Increase in sales per day
- Predicted sales Change (Day), %
- Predicted sales (Day)
- Predicted sales qty (Day)
- Increase in sales qty per day
- Predicted sales qty Change (Day), %
- Increase in profit per day
- Predicted profit Change (Day), %
- Predicted profit (Day)
- Optimal price
- Optimal price change, %
- Date of acceptance of optimal price
- Price at the moment of acceptance of the recommendation
- Primecost at the moment of acceptance of the recommendation
Note! Access to viewing the metrics according to the user's role is determined by the administrator. Contact your administrator to expand the access.
Filters
The selection of the following filters makes it possible to carry out the analysis within the specified conditions:
- Stores
- Categories
- Brands
- Category managers
- Level
- Product
- Store