LOST SALES ML
Laboratory - AI-based reports module on Datawiz BI service
Lost Sales ML - using machine learning algorithms, the report analyzes the movement of products, models sales forecasts and summarizes data on sales losses due to missing or low sales.
The functionality of the report allows:
- to identify lost sales by products, categories, stores, category managers;
- to determine the amount of losses, including due to zero balances;
- to track the dynamics of sales and balances on problem products;
- to identify the causes of losses, problem areas at work and avoid them in the future.
Based on the past sales of products for each store per year, the neural network predicts their future sales. Next, there is a comparison between the actual data and the predicted ones. If sales were less than predicted, then such sales are considered lost. Then there is already a generalization of data on losses in turnover due to missing or low sales.
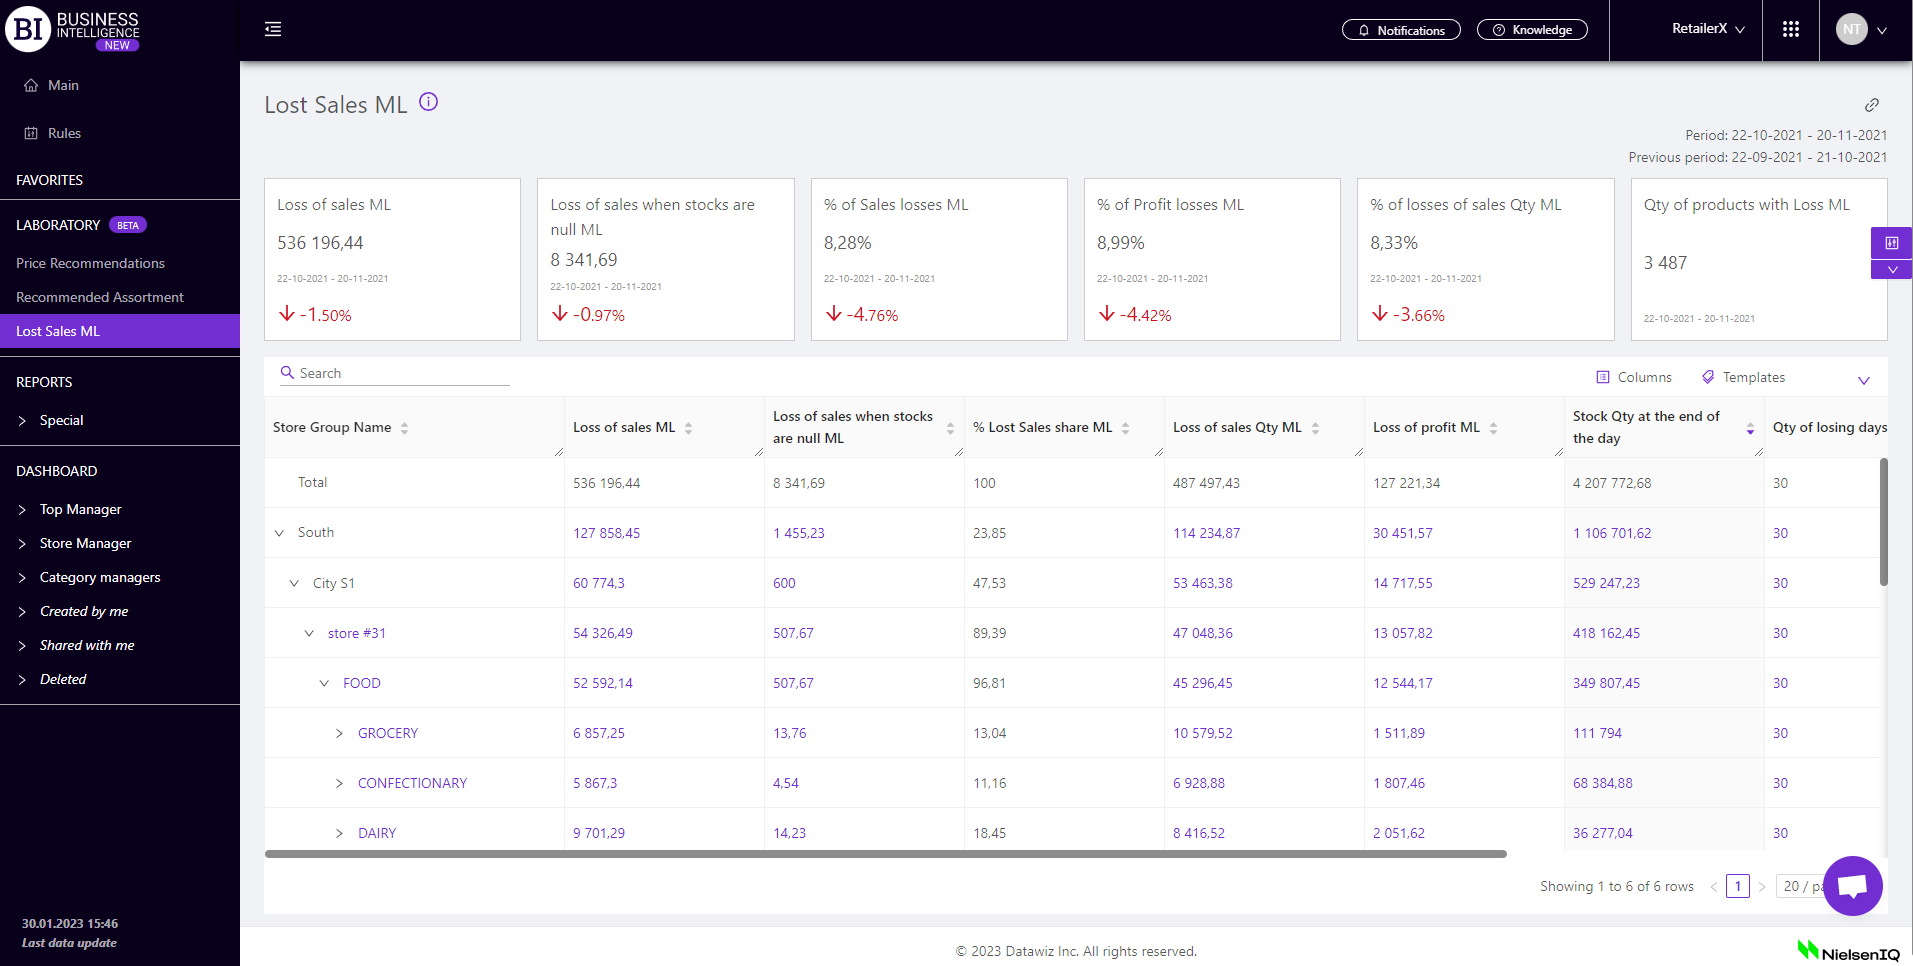
Metrics
All metrics are divided into the following subgroups:
Stocks
- Stock Qty at the end of the day
- Stock Qty at the end of the day Change
- Stock Qty at the end of the day Change, %
- Stock Qty at the beginning of the day
- Stock Qty at the beginning of the day Change
- Stock Qty at the beginning of the day Change, %
Assortment activity
Laboratory
- Loss of sales ML
- Loss of sales Change ML
- Loss of sales Change, % ML
- % Lost Sales share ML
- Loss of sales when stocks are null ML
- Loss of sales when stocks are null Change ML
- Loss of sales when stocks are null Change, % ML
- % of Sales losses ML
- Loss of sales Qty ML
- Loss of sales Qty ML Change
- Loss of sales Qty ML Change, %
- % Lost Sales Qty ML Share
- Loss of sales Qty when stocks are null ML
- Loss of sales Qty when stocks are null ML Change
- Loss of sales Qty when stocks are null ML Change, %
- % of losses of sales Qty ML
- Loss of profit ML
- Loss of profit Change ML
- Loss of profit Change, % ML
- % Lost Profit share ML
- % of Profit losses ML
- Loss of profit when stocks are null ML
- Loss of profit when stocks are null ML Change
- Loss of profit when stocks are null ML Change, %
- Qty of losing days ML
- Qty of losing days Change ML
- Qty of losing days Change, % ML
- Qty of losing days when stocks are null ML
- Qty of losing sales when stocks are null Change ML
- Qty of losing sales when stocks are null Change, % ML
Metrics highlighted in purple or red are clickable. Clicking on them opens a window with a flow chart of the chosen metric.
Visualization of the clickable metric "Loss of sales QTY ML" for the lowest level of the table - products, displays a combined graph containing the dynamics of indicators: Predicted sales (and limits of acceptable sales), Sales Qty, Stock Qty at the beginning of the day. This allows to visually track the lost days. Sales are considered lost if Sales < Predicted sales.
Similar visualization on indicators "Lost of profit ML", "Lost of sales ML".
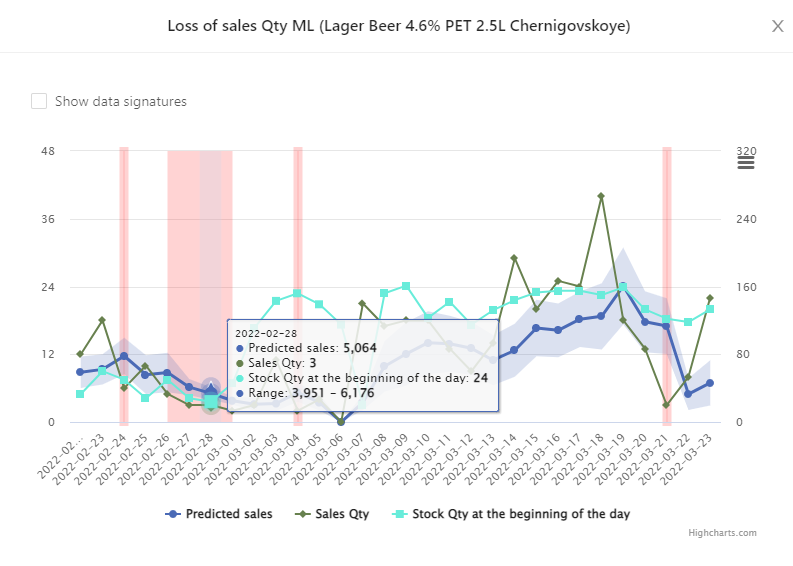
Note! The visualization of the clickable metric "Qty of losing sales" contains curves of two metrics: Sales Qty and Stock Qty at the beginning of the day. This allows to see losses due to zero or minimal stocks.
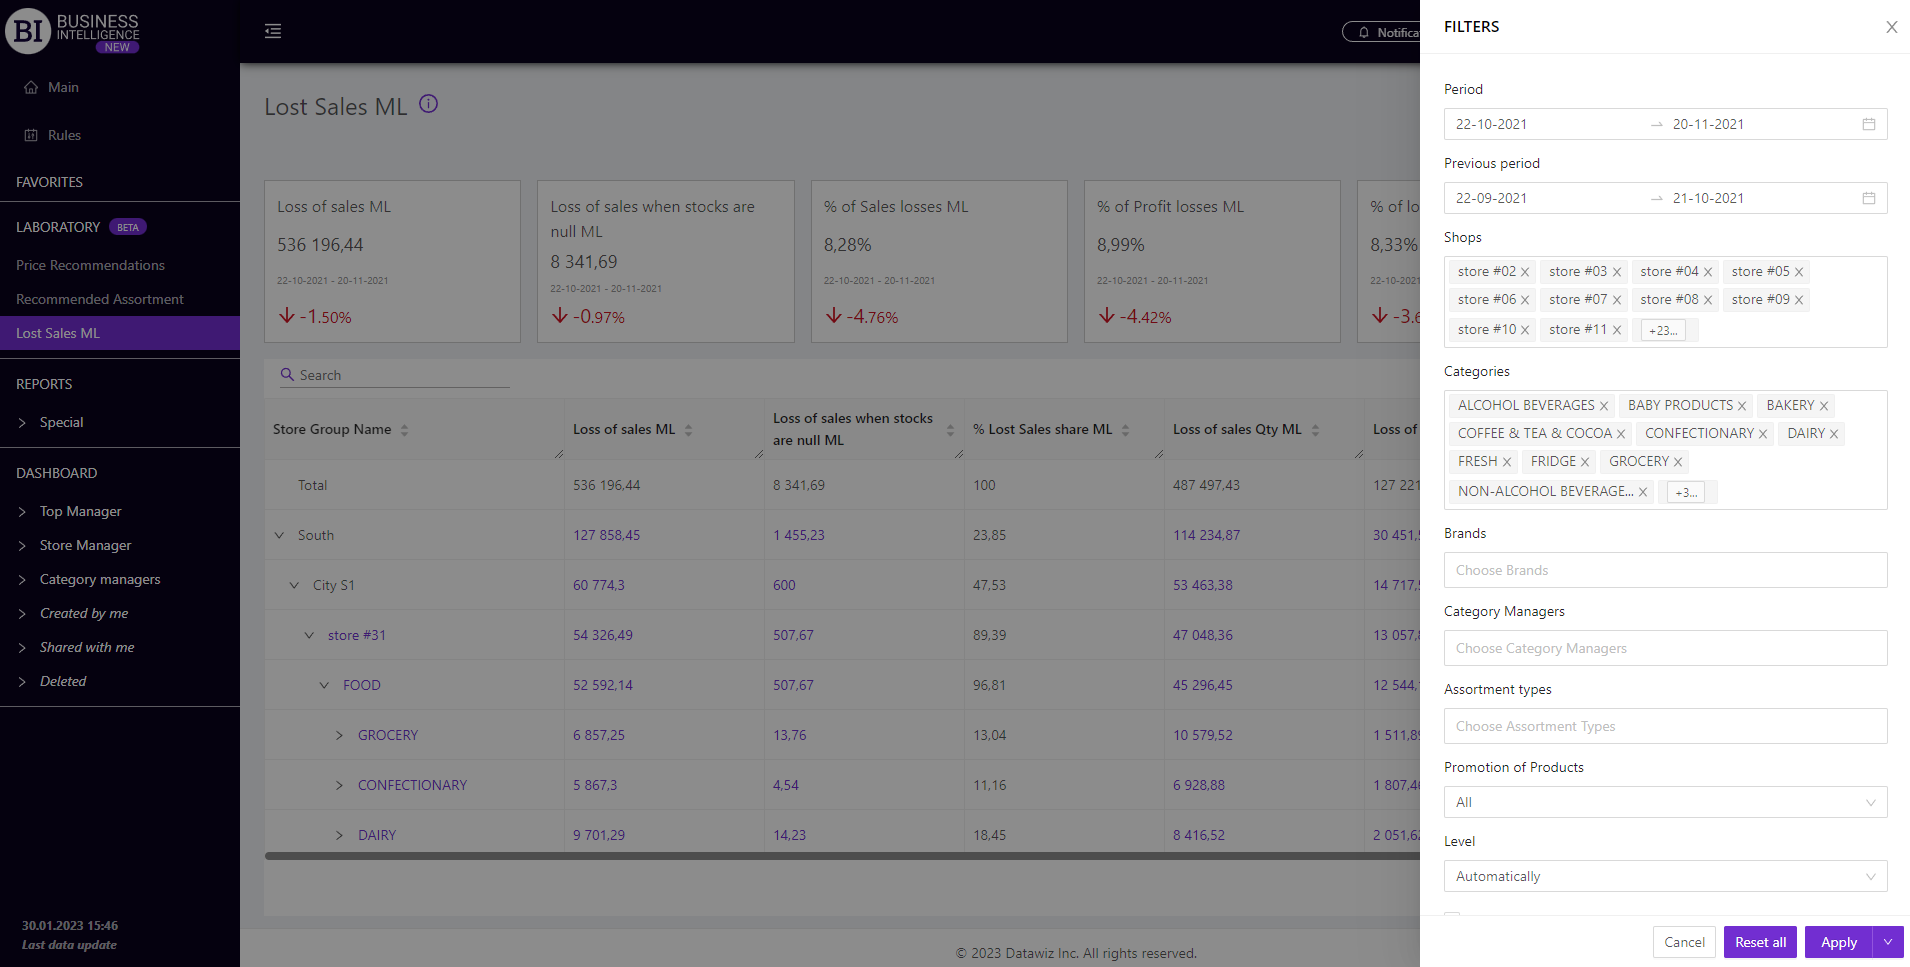
Filters
The selection of filters makes it possible to carry out the analysis within the specified conditions.
There are the following filters:
- Stores
- Period
- Previous Period
- Category Managers
- Assortment Types
- Categories
- Brands
- Level
- Promotion of products