

Last updated: October 3, 2026
What Is the BCG Matrix in Retail and How Does It Work?
The BCG matrix (Boston Consulting Group) is one of the most popular strategic management tools used to analyze product assortment, allocate resources, and identify promising business directions. In retail, it plays a key role in increasing profitability through competent management of product categories and investment.
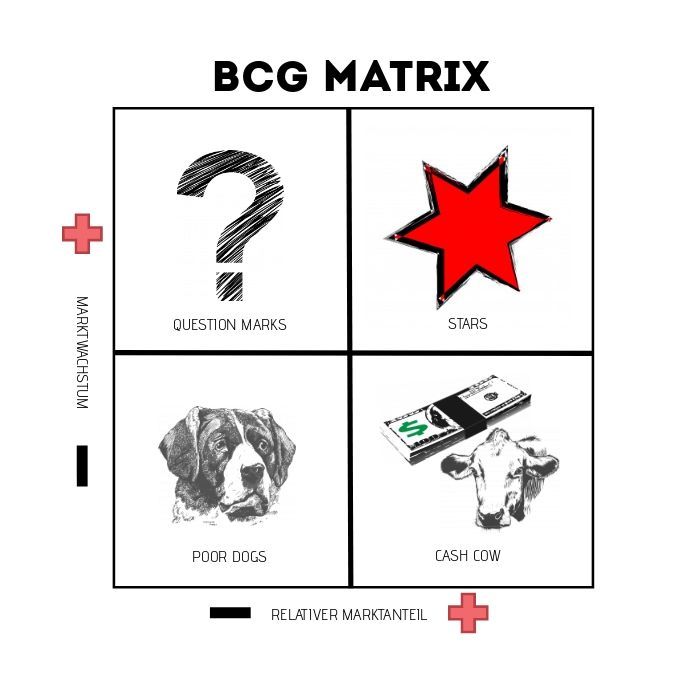
BCG's methodology is based on two key indicators:
- Market Growth Rate — reflects the dynamics of demand and indicates how promising a segment is.
- Market Share — a measure of the competitiveness of a particular product or product group.
Based on these two criteria, goods are sorted into four categories:
- Stars — leading goods with high market share and rapid growth in demand. They generate large profits but require serious investment to defend their position.
- Cash Cows — stable bestsellers with high market share but low growth rate. These products provide maximum returns without significant further investment.
- Question Marks (also called Difficult Children) — products with growth potential but still a small market share. The right investment can turn them into Stars; the wrong bet turns them into Dogs.
- Dogs — products with low demand and a small market share that need a strategy review. They're usually minimized in stock and removed from the assortment.
Products Move Between Quadrants Over Time
The matrix isn't a static label. Products shift between groups as market conditions and their own performance change. A Question Mark that gets the right investment and promotion can grow into a Star. A Star that matures and stabilizes eventually settles into the Cash Cow group. And a Cash Cow that loses relevance over time can decline into a Dog.
This is why the matrix is something to revisit regularly rather than build once and file away. Tracking where a product sits today, and where it's trending, is what makes the tool useful for forward planning rather than just a snapshot of the current assortment.
How Does the BCG Matrix Affect Revenue Growth in Retail?
Using BCG analysis in retail helps:
- Optimize the assortment by getting rid of unprofitable SKUs.
- Reduce operating costs by eliminating inefficient positions.
- Increase the share of promising products through proper budget reallocation.
- Develop marketing promotion strategies tailored to each product group.
- Support negotiations with partners, suppliers, and investors, since the matrix gives a clear, shared picture of where each product category stands.
- Guide budgeting and fund allocation across different activity areas and product lines.
The BCG matrix also allows for a more effective pricing policy. Cash Cows can support higher margins since they're already established with loyal demand, while Stars sometimes benefit from a temporary price reduction to grow market share faster while the category is still expanding.
Named Strategies for Each Quadrant
Each quadrant calls for a distinct strategic approach, and BCG analysis gives these approaches specific names:
- Increase share. Applied to Question Marks, aimed at pushing them toward the Stars group through investment and promotion.
- Maintain share. Applied to Cash Cows. The goal is to hold a high level of income from already-popular products for as long as possible, while redirecting the funds they generate into newer, growing products.
- Harvesting. A strategy for extracting the maximum possible short-term profit from products that have no long-term future and are planned for removal from the assortment, typically Question Marks and Dogs that haven't paid off.
- Business liquidation. Withdrawing Dogs and underperforming Question Marks from the assortment entirely, freeing up capital and shelf space to redirect toward other product lines.
Matching each quadrant to its named strategy, rather than treating all four groups the same way, is what turns the matrix from a classification exercise into an actual assortment plan.
Examples of Using the BCG Matrix in Retail
- Working with Stars. A retailer must actively invest in promoting and expanding the range of these products to keep them dominant. In the electronics category, for example, popular smartphone models are regularly updated and consistently supported, which keeps a steady stream of revenue flowing from the category.
- Supporting Cash Cows. These goods don't require significant further investment but bring in stable income, making them the backbone of the retail business. Basic home appliance models or everyday staples like bread and milk are reliable examples: demand for them doesn't swing much, and they don't need heavy promotion to keep selling.
- Developing Question Marks. Products in this category can become Stars if they're promoted properly. Trend-driven products like plant-based meat alternatives or newer eco-friendly product lines are typical Question Marks: genuine growth potential, but still a small share of category sales. If the investment doesn't pay off, though, these same products can slide into the Dogs group instead.
- Optimizing Dogs. Products with low popularity and thin margins are either removed from sales or repurposed for cross-selling. If a particular chocolate brand isn't moving on its own, for example, pairing it with coffee in a combo offer can extract some remaining value before phasing it out entirely.
How to Analyze the BCG Matrix: Step by Step
To get the most out of the BCG matrix, follow this process:
- Distribute products into the four quadrants based on their sales and share of total chain sales.
- Categorize and assess each quadrant's occupancy to understand the overall state of the chain's assortment.
- Apply the named strategy to each group — increase share for Question Marks, maintain share for Cash Cows, harvest or liquidate for underperforming Dogs and Question Marks.
- Reallocate budget and marketing resources based on what the analysis shows, shifting investment toward the categories that justify it.
- Track dynamics over time and adjust. Since products move between quadrants, the matrix needs to be revisited on a regular cycle, not treated as a one-time exercise.
BCG Matrix Analysis with an Analytics Platform
Building a BCG matrix by hand in a spreadsheet works for a small, stable assortment. It gets harder fast once a chain carries thousands of SKUs across multiple categories and locations, especially since products are supposed to shift quadrants over time and a manual matrix goes stale the moment it's built.
Retail analytics platforms like Datawiz automate this process. A dedicated BCG matrix report allows retailers to:
- Group products by matrix quadrant automatically, instead of sorting manually.
- Change the criteria used to distribute products into quadrants: Sales Value, Sales Qty, Profit, Margin, Mark-up, and similar metrics, depending on which lens matters most for a given category.
- Study detailed sales metrics and how they change over time for each product group.
- Get timely, data-backed signals for reallocating budget and shelf space before a Star quietly slides toward Cash Cow, or a Cash Cow starts drifting toward Dog.
This keeps the BCG matrix as a living tool rather than a one-off slide deck: the quadrant picture updates as sales data comes in, which is what the matrix needs to stay useful for ongoing assortment decisions rather than a single strategic review.
The BCG Matrix as an Ongoing Retail Strategy
An assortment management strategy built on the BCG matrix isn't a single analysis, it's a recurring cycle: distribute products into quadrants, assign each the named strategy that fits it, reallocate budget accordingly, then revisit the picture as sales data and market conditions shift. Products that start as Question Marks today may be Stars in a year, or Dogs if the bet doesn't pay off, which is exactly why this needs to run on a schedule rather than get built once and shelved.
Supported by an analytics platform that keeps the quadrant assignments current, the BCG matrix becomes less of a one-time strategic exercise and more of a standing part of how a retail chain manages its assortment, reduces costs on underperforming SKUs, and keeps investment flowing toward the categories that are actually earning it.

Make decisions based on real data with Datawiz BI




 No credit card required