

Last updated: October 3, 2026
Promotions have become an integral part of retail business, aimed at stimulating sales and attracting new customers. A chain offers temporary discounts, bonuses, and promotions that lift demand for specific products and help clear stock in warehouses faster.
Organizing a promo involves many departments working together. Marketing creates the concept and communicates with customers, purchasing and logistics ensure product availability, IT sets up the discount systems, and finance monitors profitability. Analysts track performance, and sales staff interact directly with customers. Without coordinated action, a promotion can turn into chaos: product shortages, overloaded warehouses, or losses. Retailers that manage promo stock without SKU-level analytics report excess post-promo inventory as one of the top three causes of unplanned markdowns, which directly reduces the net return on the campaign. A successful retail promotion is not just an attractive offer, it's a coherent operational strategy.
Key Takeaways
- A retail promotion is unprofitable if the Cannibalization Rate exceeds 15 to 20%: customers switch from high-margin items to discounted ones, and total basket profit drops even when sales volume grows.
- ROI on a promotion should be calculated from net margin, not just revenue. A 30% discount on a product with 25% gross margin always generates a loss regardless of sales volume.
- Short-term promos (1 to 3 days) drive impulse purchases but rarely attract new customers. Medium-term promos (1 to 2 weeks) work better for audience acquisition and retention measurement.
- Retailers who track promo performance at the SKU level, not just the category level, reduce excess post-promo stock by up to 15.5%, avoiding markdowns and write-offs after the campaign ends.
- Without unique promo codes or isolated customer segments, there's no reliable way to separate organic demand growth from promo-driven sales, which makes ROI calculations unreliable and campaign comparisons meaningless.
Why Run a Promotion?
The most obvious goal of any promotion is better profit, but a well-planned promo usually serves one of a few specific purposes:
- Increase turnover. A wide assortment always has SKUs that sit in a blind spot for both the customer and the retailer. Promoting those positions clears them before they become dead stock.
- Launch a new product. New SKUs that aren't actively introduced often go unnoticed, which leads to write-offs and capital frozen in unsold stock. A promotion gets customers to actually try the product.
- Clear surplus. When stock is sitting in excess, promoting it directly, through bundle deals, percentage discounts, or a gift tied to basket size, is usually the fastest way to move it.
- Address slipping demand. A product can become irrelevant to customers for reasons that have nothing to do with price. A promotion's results often expose a supplier or manufacturer issue, or signal that the assortment itself needs adjusting.
- Compete during peak season. Competition between retailers intensifies around seasonal demand, and margins take the hit first. A well-prepared seasonal promo is what pulls in the most customers during that window.
Key Performance Indicators of Retail Promotions
Evaluating the effectiveness of retail promotions comes down to specific metrics that show the real impact on sales, margins, and customer behavior.
1. Sales and revenue
- Sales Growth (%): how much sales increased during the promotion.
- Revenue from promotional merchandise: how much money the campaign brought in.
- Proportion of sales from promotional merchandise (%): how much of total sales the promotional items account for.
Segment this data by product category, customer segment, or geographic region to see which parts of the business actually benefited, and use that to refine future campaigns.
2. Marginality and profitability
- Marginability (%): whether the discount ate into all of the profit.
- ROI (Return on Promo Investment): whether the promotion actually paid off.
- Cannibalization Rate: whether customers replaced the promotional item with a more profitable non-promotional one instead of buying more overall.
3. Customer attraction and retention
- Average Check: whether customers started buying more per visit.
- Number of new customers: whether the promotion actually brought in new buyers.
- Frequency of purchases: whether the promo motivated people to come back.
Unique promo codes and coupons placed in ads, email newsletters, or at checkout show exactly how many customers came through the promotion, and which channel brought them in.
Promotions and True Customer Loyalty
People often equate loyalty with repeat purchases, but that's not quite accurate for a promotion. The real signal of success is a customer who comes back and buys the same product again at its normal price, once the promotion has ended. That means they liked the product itself, not just the discount, and that's what true loyalty looks like.
It's worth pairing this with compensatory analytics: if a promo cuts the price and profitability drops as a result, the data should show a corresponding rise in units sold. Only then can the promotion actually be called effective.
How to Organize a Successful Promo
WHAT? (Selecting Specific SKUs)
Category of goods:
- The most popular products (sales hits).
- New products that need exposure.
- Products with low turnover that need a demand boost.
Financial analysis:
- Setting a discount level that won't erase profitability entirely. For most FMCG categories, discounts above 25 to 30% on products with standard gross margins of 20 to 30% eliminate profit entirely, meaning volume growth alone can't make up for the margin loss.
- Estimating potential sales growth.
- Checking current stock levels for the selected SKUs ahead of time, and planning the inventory needed to cover expected demand above normal sales, so the promotion doesn't run into a stockout mid-campaign.
Cannibalization check:
- Analyzing whether a promotional item will crowd out higher-margin items instead of adding incremental sales.
WHEN? (Clear Limits for the Promo)
Duration of the promotion:
- Short-term (1 to 3 days): encourages impulse buying.
- Medium-term (1 to 2 weeks): builds stable demand.
- Long-term (1+ month): used for strategic category growth.
Seasonality:
- Promos tied to holidays, sales events, and trends.
- Demand analysis across different times of year.
Periodicity:
- Regular promos (monthly, seasonal) to keep bringing back regular customers.
- One-off promotions to test new SKUs.
WHO? (Supplier Selection)
Supplier category:
- Own brands, to build awareness.
- Known brands, for joint promotions that pull in a shared audience.
- New suppliers, to test market acceptance of a new product.
Financial terms of cooperation:
- Discount percentage covered by the manufacturer.
- Joint coverage of advertising costs.
- Additional bonuses tied to high sales volume.
Supplier readiness:
- Can the supplier actually support the promotional volume?
- Is there a reliable guarantee against a mid-promo shortage?
Promotion Merchandising and Execution
How a promotion looks on the shelf matters as much as how it's planned on paper. An eye-catching layout, clear advertising banners, and well-placed "Sale" signage are what turn a planned discount into an actual impulse purchase at the shelf. Getting this right is a joint task for marketing and merchandising, informed by what worked in past promotions as much as by creative instinct.
How to Analyze the Effectiveness of a Promotion
The "Promotion Analysis" report in Datawiz BI summarizes the main indicators of a chain's promotional activity. It shows sales of promotional products across the network for each campaign, and lets you:
- Evaluate the performance of each promotion, drilling down to categories and individual SKUs.
- Track the behavior of promotional goods during the promo period against the normal trading period.
- Analyze the dynamics of key indicators through visualizations.
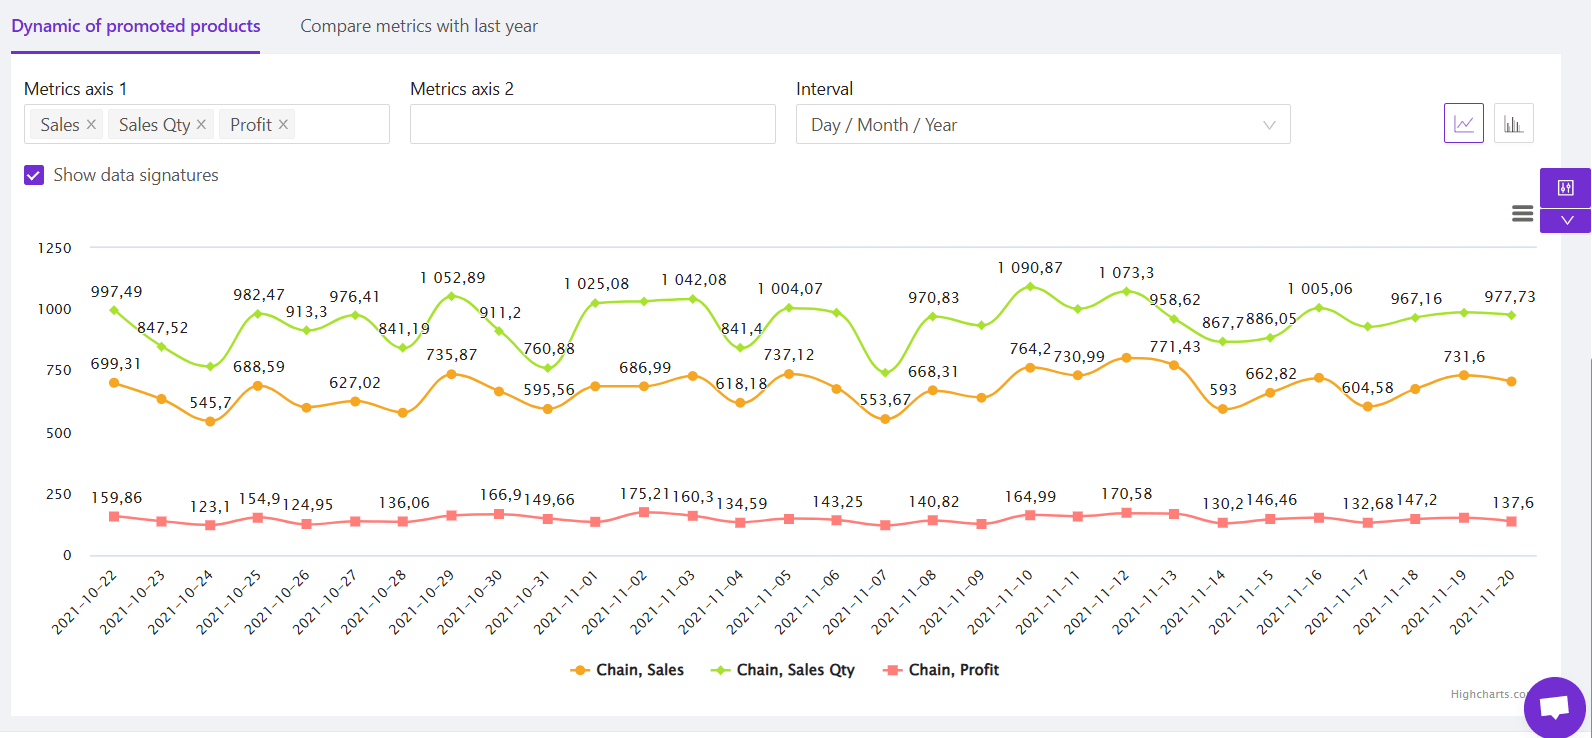
The report's strongest feature is the "compare promotions" tab, which puts several promotions side by side and visualizes their performance on selected indicators, as either a line graph or a bar chart.
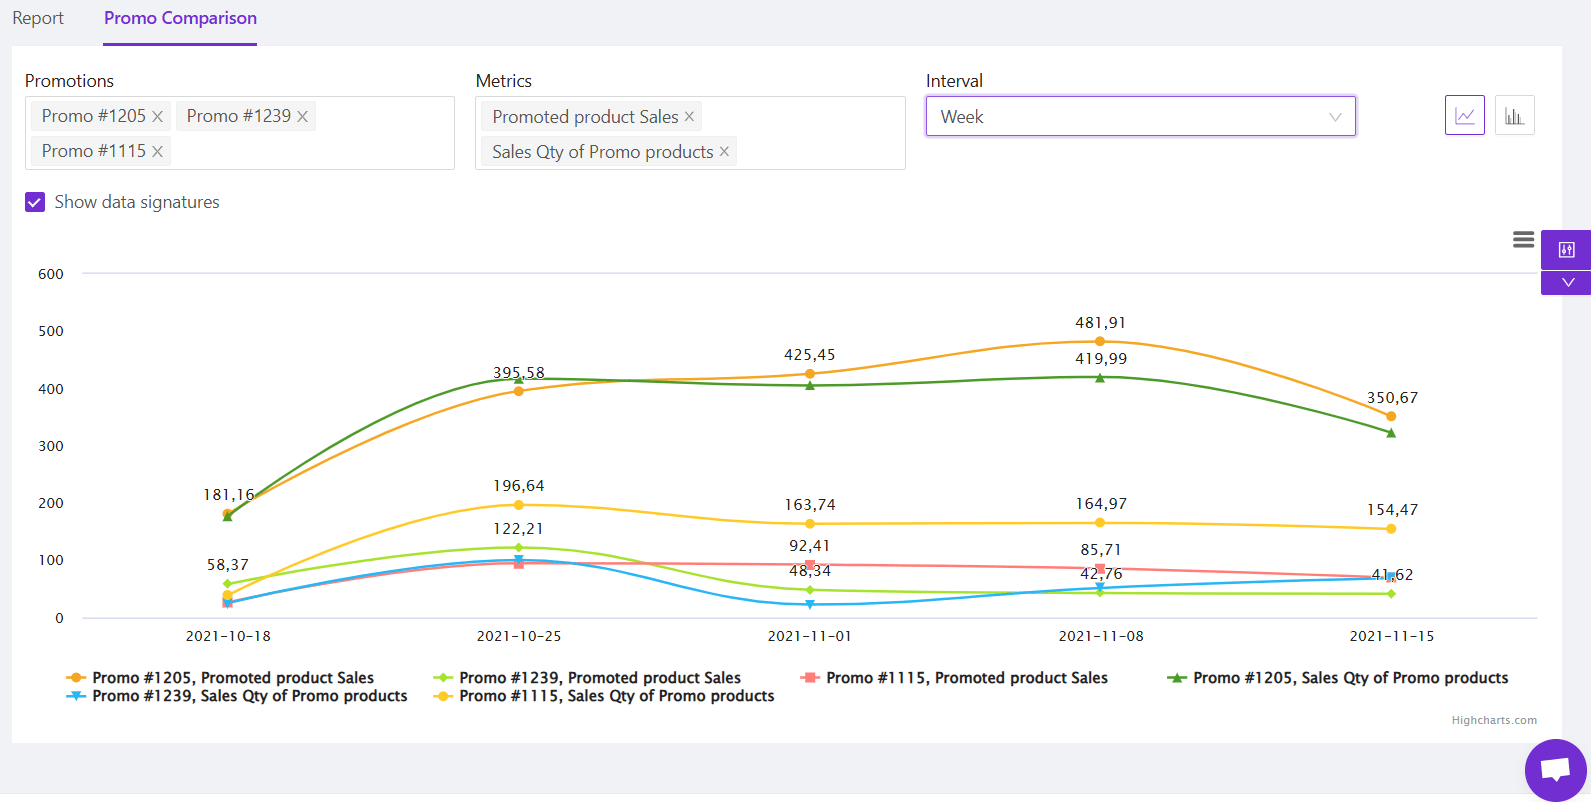
All promo data lives in one place, so there's no need to pull information from every department separately. What matters isn't just seeing the numbers, it's understanding what they mean: which promotions actually generate profit, which bring in new customers, and which quietly run at a loss. That kind of analysis is what keeps a chain from repeating the same mistake in the next campaign.
FAQ
What metrics actually show whether a retail promotion was profitable?
The core profitability metrics are ROI on promo investment and margin after discount. Compare net margin per SKU during and after the promotion, not just sales volume. If margin dropped while units sold increased, the promotion ran at a loss.
How do I calculate the cannibalization rate for a promo?
Cannibalization rate is the share of promotional sales that came at the expense of higher-margin non-promotional items. Calculate it by comparing sales of adjacent SKUs during the promo period against the same period without a promotion. A rate above 15% is a signal to redesign the product selection for future campaigns.
How long should a retail promotion run to be effective?
It depends on the goal. Promos lasting 1 to 3 days maximize impulse purchases. Campaigns of 1 to 2 weeks work better for building stable demand and measuring repeat purchase frequency. Promotions longer than a month are typically used for strategic category growth rather than a short-term sales spike.
How do I know if a promotion actually brought in new customers?
Use unique promo codes, dedicated landing pages, or isolated coupon batches tied to specific channels. Compare the customer ID list from promo transactions against your existing base. Without this kind of segmentation, there's no way to distinguish new buyers from regulars who simply waited for a discount.
How can I automate promotion analysis across multiple campaigns?
Datawiz BI includes a dedicated Promotion Analysis report that consolidates promo performance data across every campaign and store location without manual data collection. It lets you drill down from network-level results to individual SKUs and compare multiple promotions side by side using line graphs or bar charts, instead of gathering data from each department separately.
What's the most common mistake retailers make when evaluating promotions?
Measuring only sales volume without tracking margin and cannibalization. A promotion that grows revenue by 20% but reduces average basket margin by 25% is a net loss, even though it looks successful in a basic sales report. Always pair top-line metrics with profitability and post-promo recovery data.

Make decisions based on real data with Datawiz BI



 No credit card required