

Last updated: September 15, 2026
A mid-size chain runs in-store sales through a POS, online orders through an ecommerce platform, promotions through an ad account, and restocking through supplier feeds. Each system counts and labels things its own way, so reconciling them by hand takes days and costs margin every time a markdown or a reorder lands late.
Retail analytics software does that reconciliation for you. It pulls records from every connected system, maps them into one structure, and turns them into pricing, inventory, and marketing decisions while those decisions still matter.
What the tools in this category don't share is how much work they leave on your side. Some ship with retail metrics, category hierarchies, and POS connectors ready to use. Others give you a blank canvas and assume a data team. This article compares 14 retail analytics platforms, explains the criteria behind the list, gives realistic implementation timelines for each, and says which one fits which situation.
How We Evaluated These Platforms
We compared platforms across five criteria:
- Retail-specific data models. Whether the platform ships with pre-built retail metrics (sell-through, shrinkage, planogram compliance) or requires you to build them.
- Connector breadth. The number of documented POS, ERP, and ecommerce integrations available out of the box.
- Time-to-value. Vendor-stated implementation timelines checked against independently reported deployment experiences, not just sales copy.
- Multi-location support. Whether the platform has chain-level features such as store comparison and role-based views, or is built for a single storefront.
- Cross-source validation. Checking each platform against multiple independent 2026 industry rankings, G2/Capterra reviews, and vendor documentation, rather than relying on any single source.
The shortlist was built two ways. First, platforms that appear repeatedly across independent top-rated lists and category rankings for retail analytics in 2026. Second, platforms we already knew served retail or ecommerce specifically, or general-purpose BI tools widely adopted by retailers (Tableau, Power BI, Looker, Qlik). We left out single-purpose store-operations tools, such as pure foot-traffic sensors, that don't function as standalone analytics platforms.
These 14 platforms aren't all solving the same problem, and they're not all direct alternatives to each other. Grouped by what they do:
- Full retail-operations platforms (Datawiz, Oracle Retail Analytics): sales, inventory, promotions, staff, and merchandising in one tool.
- General-purpose BI (Tableau, Power BI, Looker, Qlik, ThoughtSpot, Sisense, Domo, Strategy): flexible visualization layered on data you bring and often model yourself.
- Ecommerce/DTC analytics (Shopify Analytics, Polar Analytics, Triple Whale): built around a specific storefront stack, usually Shopify.
- CPG brand-side analytics (Alloy.ai): built for brands selling through major retail and ecommerce partners, tracking sell-in/sell-out performance across accounts rather than running a single storefront.
Comparing two platforms from the same category means choosing between genuine alternatives. Comparing across categories, say Datawiz against Alloy.ai, means deciding what kind of tool you need in the first place.
What Are Retail Analytics Platforms?
A retail analytics platform does three things. It pulls raw records from each connected system on a schedule or in real time. It maps them into a common structure, so that a "sale" from the POS and a "sale" from the ecommerce platform count the same way. Then it surfaces that unified data through dashboards, alerts, or natural-language queries.
The mapping step separates a retail-specific tool from a generic one. Platforms like Datawiz or Oracle already know that a SKU belongs to a category, a category to a department, and a promotion to a specific date range, so that logic doesn't have to be built by hand. General-purpose BI tools skip that step and leave the structure up to you.
Retail Analytics Platforms Compared
| Platform | Category | Best for | Retail-specific | Implementation | Key strength |
|---|---|---|---|---|---|
| Datawiz | Full retail operations | Multi-location chains (5+ locations) | Yes | Weeks | Full value chain in one platform |
| Oracle Retail Analytics | Full retail operations (enterprise) | Enterprise retailers (50+ locations, $100M+) | Yes | 2–6 months | 200+ pre-built retail metrics |
| Alloy.ai | CPG brand-side retail analytics | CPG brands selling through major retail/ecommerce partners | Yes | 2–3 months | 450+ pre-built retailer, ERP, and 3PL integrations with SKU-store level visibility |
| Shopify Analytics | Ecommerce/DTC | Shopify merchants | Yes | Immediate | Zero-setup built-in reporting |
| Polar Analytics | Ecommerce/DTC | Shopify/DTC brands (up to ~$1.5M GMV) | Yes | Days | Deterministic, order-level attribution |
| Triple Whale | Ecommerce/DTC | Shopify/DTC brands (<$20M revenue) | Yes | Days–weeks | All-in-one dashboard + AI assistant |
| Looker | General BI | Enterprises on Google Cloud | No | 3–6 months | Governed metrics via LookML |
| ThoughtSpot | General BI | Business users, C-suite | No | Weeks–months | Natural-language query |
| Tableau | General BI | Flexible, exploratory visualization | No | Weeks–months | Drag-and-drop visualization |
| Power BI | General BI | Microsoft 365/Azure retailers | No | Weeks–months | Microsoft ecosystem integration |
| Sisense | General BI / embedded | Companies embedding analytics into their product | No | Weeks–months | Embedded/white-label SDK |
| Domo | General BI | Multi-location retailers with fragmented sources | No | Weeks | 1,000+ pre-built connectors |
| Qlik | General BI | Associative, ad hoc data exploration | No | Weeks–months | Associative engine |
| Strategy | General BI (enterprise) | Enterprise retailers | No | Weeks (trial) to months (full rollout) | In-workflow insights via HyperIntelligence |
Best Retail Analytics Software — Reviewed
The best retail analytics platforms are grouped below by category: full retail-operations tools first, then ecommerce and CPG-focused platforms, then general-purpose BI.
1. Datawiz
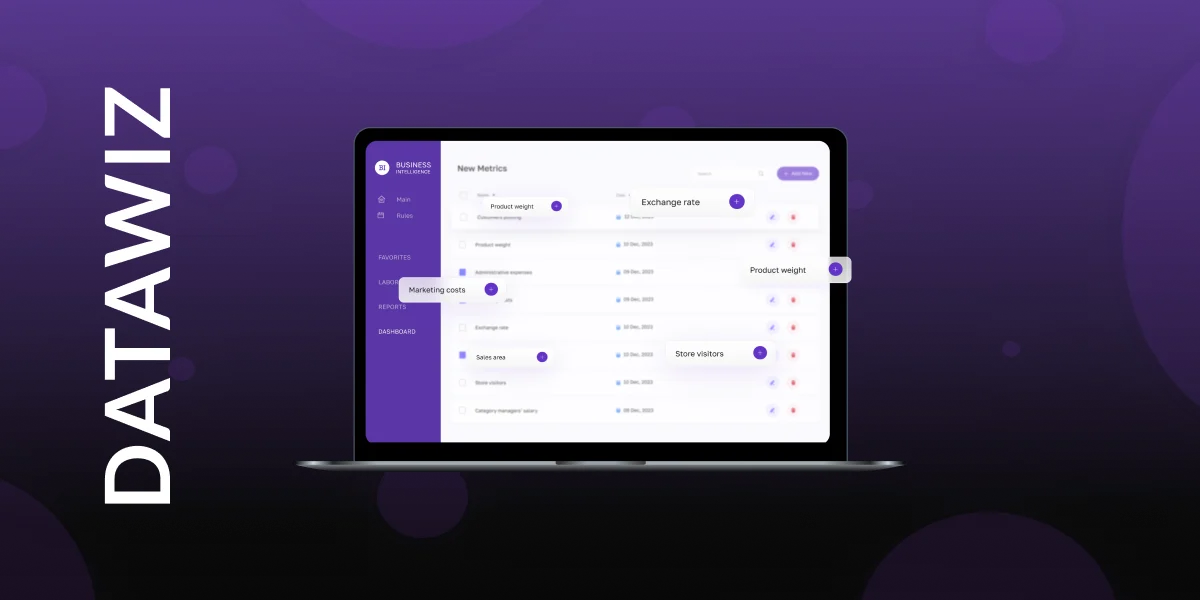
Datawiz BI covers the full retail value chain, from SKU-level sales analysis and stock control to supplier performance tracking and planogram compliance. Reported results include a 15.5% reduction in excess inventory and a 28% improvement in per-SKU financial outcomes for retail chains with 5+ locations. Metrics are available at store, department, and supplier level as well as chain-wide.
Datawiz covers the following areas through real-time data intelligence:
- Sales and Product Analysis: track SKU-level performance, identify top and underperforming items, analyze product bundles, and monitor cross-selling effectiveness from one dashboard.
- Stock Control: anticipate demand fluctuations, optimize reorder points, reduce shrinkage, and maintain inventory levels across locations.
- Customer Loyalty Program Analysis: measure shopper lifetime value, segment audiences by purchase behavior, quantify loyalty-driven revenue, and detect early signs of customer churn.
- Supplier Relationship Management: monitor vendor lead times, evaluate delivery reliability, assess profit margins by supplier, and benchmark supplier performance over time.
- Promotion Analysis: measure short-term uplift and long-term behavioral shifts, identify the most effective discount mechanics, and attribute results to specific customer segments.
- Cashier and Staff Performance Tracking: assess speed and efficiency at checkout, spot training needs, recognize top performers, and reduce human error at the point of sale.
- Merchandising Efficiency: evaluate planogram compliance, analyze sales by shelf position, and determine which product placements drive higher conversions and ROI.
Retail managers, marketing teams, and executives can each pull the metrics relevant to their role from the same platform. It's used by retailers ranging from single ten-store chains to multinational operations, with a cloud-based, modular setup.
Best for: multi-location retail chains that want one tool covering sales, inventory, promotions, staff, and merchandising instead of stitching together several point solutions. In practice, it's used by chains ranging from around 10 stores to large multinational operations.
Implementation: cloud-based and modular. Most retailers can evaluate core functionality within the 14-day trial window, and fuller multi-location rollouts take a few additional weeks depending on how many modules are activated.
Pros:
- Covers sales, inventory, merchandising, supplier, and staff analytics in one platform.
- Supports SKU-, store-, department-, and supplier-level analysis, not just chain-wide totals.
- 14-day free trial with no credit card required.
Cons:
- Less suited to non-retail industries or businesses without physical store operations.
- As a retail-specific platform, it won't match the customization depth of general-purpose BI tools like Tableau or Looker for highly bespoke reporting.
2. Oracle Retail Analytics
Oracle Retail Analytics, part of Oracle Retail Insights Cloud Service, is built for large retail chains that need pre-built retail metrics without constructing a data model from scratch. It ships with 200+ retail-specific metrics covering sell-through, stock cover, margin, and promotional uplift, and pairs with Oracle Retail AI Foundation for demand forecasting, markdown optimization, and inventory allocation.
Key features:
- 200+ pre-built retail metrics spanning merchandising, supply chain, and customer analytics.
- Embedded AI/ML models for demand forecasting, markdown optimization, and size scaling.
- Native integration with Oracle RPAS (demand planning) and Oracle Retail Merchandising System for cross-functional reporting.
Oracle's pre-built retail data model removes much of the schema-building work that generic BI tools require, at the cost of committing to the Oracle ecosystem.
Best for: enterprise retailers (50+ locations, $100M+ revenue) that want deep, pre-built merchandising and demand-forecasting analytics and are prepared to invest in a longer implementation.
Implementation: typically 2–6 months for enterprise deployments, covering data model configuration, integration setup, and user training.
Pros:
- The most comprehensive pre-built retail metric library on this list, which eliminates significant custom schema work.
- Strong native integration across the wider Oracle Retail suite (merchandising, planning, POS).
- Built-in AI/ML for forecasting and markdown/pricing optimization, not just reporting.
Cons:
- Deep commitment to the Oracle ecosystem can make migration difficult later.
- Enterprise deployments require significant IT and stakeholder involvement.
3. Alloy.ai
Alloy.ai helps CPG brands connect retail demand signals with supply chain operations by combining POS, inventory, ERP, and ecommerce data into a single platform. Teams get faster visibility into what's happening across retailers, distribution channels, and individual stores.
Alloy.ai's main differentiator is SKU-store level visibility. Brands can track inventory and sales performance down to specific store shelves instead of working from aggregated regional reporting, which helps teams identify phantom inventory, out-of-stocks, and fulfillment gaps before they hit revenue.
The platform includes more than 450 pre-built integrations across retailer portals, ERPs, ecommerce systems, and 3PL providers, which helps brands centralize fragmented retail data and shorten implementation timelines. Alloy.ai also offers Agentic AI capabilities that automate workflows, identify replenishment opportunities, simulate supply chain risks, and generate predictive POS forecasts.
Best for: CPG brands selling through major retail and ecommerce partners such as Target, Costco, Kroger, Home Depot, and Amazon, especially companies managing complex omnichannel operations across multiple retail accounts.
Implementation: 2–3 months. Go-live falls around week 5–8, with full project close-out by week 11–12, per the published implementation timeline.
Pros:
- Automated data normalization across EDIs, APIs, and flat files, paired with real-time inventory visibility and OTIF/out-of-stock risk monitoring.
- Demand forecasting and scenario simulation that keeps supply chain and retail sales data aligned.
- AI-powered workflow automation.
Cons:
- Built specifically for CPG and retail, so teams outside these industries may not benefit from its retailer-specific integrations and workflows.
- Pricing is not publicly available and requires contacting sales for a quote.
4. Shopify Analytics
Shopify Analytics is integrated into the Shopify ecosystem and combines ecommerce and POS data in one dashboard. It requires no third-party connectors and no manual data aggregation. Customer acquisition channels, inventory turnover, and sales trends are all visible in real time.
More than 60 customizable dashboards are available out of the box, with behavioral filters that let retailers drill into specific customer segments or campaign results. Shopify's built-in analytics suit fast-growing DTC brands that need quick insights without paying extra for third-party BI tools.
Best for: Shopify merchants who want built-in reporting without adding a separate BI tool or third-party connectors. That typically covers single-location stores up through mid-size multi-store DTC brands still running everything through Shopify.
Implementation: immediate. It's built into every Shopify store, with no setup, connectors, or configuration required to start using core dashboards.
Pros:
- Zero setup. Works out of the box for any Shopify store, no connectors needed.
- 60+ prebuilt dashboards with behavioral filters for customer segmentation.
- Included in Shopify's platform cost rather than billed as a separate line item.
Cons:
- Locked to the Shopify ecosystem, so it's unusable if you run on a different ecommerce or POS platform.
- Deeper dashboards and cohort analysis require the higher Shopify plan tiers.
5. Polar Analytics
Polar Analytics is tailored for Shopify users and simplifies omnichannel reporting by integrating directly with platforms like Amazon, Klaviyo, and TikTok. It offers one-click data consolidation and a library of preloaded retail KPIs.
Real-time alerts flag sudden dips in performance, and its private database architecture is built for data privacy and query speed. Polar suits scaling ecommerce stores that need agility in their analytics.
Best for: Shopify/DTC brands that want a dedicated data warehouse and deterministic rather than modeled attribution without building one themselves. It's built primarily for growing brands up to roughly $1.5M in GMV, though it extends beyond that as order volume scales.
Implementation: fast. One-click data consolidation for Shopify/DTC stacks, with most stores live within days.
Pros:
- Deterministic, order-level attribution rather than modeled or estimated data.
- Dedicated Snowflake database per customer with full SQL access.
Cons:
- Narrower focus than general BI tools. It's built around Shopify/DTC workflows and is less suited to brick-and-mortar-heavy retailers.
- Smaller, largely self-funded company compared with VC-backed competitors like Triple Whale, which may mean a smaller roadmap and support team.
6. Triple Whale
Triple Whale centralizes zero-party and first-party data into a single retail dashboard. Its AI assistant, Moby, surfaces recommendations automatically and generates visual summaries of key performance indicators.
Features like Sonar data enrichment help brands move beyond revenue tracking to profitability analysis. The platform suits DTC brands with a strong Shopify presence that want to unify paid media data with in-store and online sales.
Best for: Shopify/DTC brands that want an all-in-one dashboard covering attribution, creative reporting, and profitability without assembling several point tools. It's most common among brands under roughly $20M in revenue, particularly on Shopify Plus.
Implementation: generally fast for Shopify-based stores, in line with other DTC-focused platforms, though the AI and marketing-science add-ons need extra configuration time.
Pros:
- Runs on a meaningful share of Shopify Plus stores, making it a widely adopted choice in the DTC space.
- Combines attribution, creative performance, and profitability analysis in one subscription rather than separate tools.
- The Moby AI assistant surfaces recommendations automatically rather than requiring manual analysis.
Cons:
- Attribution is modeled and pixel-based rather than deterministic, which some data-mature teams find less precise than warehouse-native alternatives.
- Advanced AI and marketing-science features often ship as a separate add-on module rather than in the base plan.
7. Looker
Looker provides customizable dashboards and advanced modeling capabilities, and is widely used at enterprise scale. Its main advantage is scalability and integration with Google Cloud Platform, which gives retailers access to Vertex AI for predictive modeling and AI-powered workflows.
Looker connects to over 800 data sources, so businesses can centralize their data strategy, automate reporting, and embed analytics into customer-facing applications. It suits retailers with large, complex datasets and teams capable of building custom data models.
Best for: enterprises already on Google Cloud that need governed, consistent metric definitions across many teams and dashboards. It generally fits organizations operating at multi-brand or multi-region scale rather than a handful of stores.
Implementation: typically three to six months, since LookML semantic-layer development requires dedicated data engineering resources before dashboards are usable.
Pros:
- The LookML semantic layer keeps metric definitions consistent across every team and dashboard, so teams stop arguing over whose revenue number is correct.
- 800+ data source connectors and deep Vertex AI integration for predictive modeling.
- Git-based version control for analytics code enables safe testing and rollback.
Cons:
- LookML has a steep learning curve and generally requires dedicated data engineering support.
- No pre-built retail metrics. You build the data model from a blank canvas, which extends time-to-value.
8. ThoughtSpot
ThoughtSpot is built around AI-driven querying. Users ask questions in plain English, such as "What were my best-selling products in California last week?", and receive visual results without writing queries manually.
Its built-in AI analyst continuously scans data for trends, outliers, and emerging risks without being prompted. ThoughtSpot suits C-suite leaders who want direct access to insights without relying on data teams.
Best for: C-suite and business users who want natural-language answers from data without writing queries or waiting on analysts. It's most commonly adopted by mid-size to large retail organizations with enough data volume and departmental complexity to justify a dedicated semantic layer.
Implementation: several weeks to a couple of months, depending on how much semantic-layer configuration is needed before natural-language search performs reliably.
Pros:
- Natural-language search makes it usable by non-technical executives.
- Automated anomaly and trend detection surfaces issues before anyone goes looking for them.
- Works with modern cloud warehouses including Snowflake, BigQuery, and Databricks.
Cons:
- Requires upfront semantic-layer configuration before natural-language search works reliably, which adds setup time.
- Consumption-based usage means costs need active monitoring as query volume scales, rather than sitting on a fixed budget line.
9. Tableau
Tableau, now part of Salesforce, is known for intuitive dashboarding and drag-and-drop report creation. Marketers, merchandisers, and finance teams can build visual narratives around data without heavy technical setup.
Its Slack integration supports collaboration across departments. The platform covers everything from inventory management to sales trend forecasting, and is particularly useful in organizations already using Salesforce CRM.
Best for: teams that want flexible data visualization and are willing to invest time in building their own retail data model. It works at essentially any store count, from single-location retailers to large chains, since the constraint is data engineering resources rather than company size.
Implementation: weeks to a few months, driven mainly by schema design and ETL work rather than the tool itself.
Pros:
- Best-in-class drag-and-drop visualization with a large user community and extensive learning resources.
- Deep Salesforce and Slack integration for teams already in that ecosystem.
Cons:
- No pre-built retail metrics. Expect schema design and ETL work before dashboards are useful.
- Advanced use requires SQL and data modeling knowledge, and support can be slow for non-enterprise accounts.
10. Microsoft Power BI
Power BI brings Microsoft's AI tools into everyday retail operations. It integrates with Excel and Microsoft Teams and suits businesses already running on Microsoft 365.
Semantic modeling, data governance controls, and role-based access let retailers control who sees what without losing depth of insight. It's a practical option for retailers that want strong capabilities without a heavy new infrastructure investment.
Best for: retailers already standardized on Microsoft 365/Azure that want capable BI without adding a new vendor ecosystem. It suits small and mid-size chains especially well, since it doesn't demand the data engineering investment that enterprise-only platforms do.
Implementation: comparable to Tableau. Typically weeks to a few months for schema and dashboard build-out, faster if your data is already reasonably clean in Excel or Azure.
Pros:
- Tight Excel and Teams integration means less retraining for existing Microsoft users.
- Strong governance and role-based access controls out of the box.
- Lower overhead to get started than enterprise-only platforms if you're already on Microsoft's stack.
Cons:
- Like Tableau and Looker, it has no pre-built retail data model, so you build schemas from scratch.
- Best value applies mainly to teams already on Microsoft's stack, and it's less compelling on AWS or Google Cloud.
11. Sisense
Sisense blends traditional and embedded analytics in one customizable platform. It fits companies that want to deliver white-labeled dashboards to internal or external users.
Its Fusion platform lets low- and no-code users build advanced analytics tools without depending on data science teams, with predictive modeling and flexible deployment options.
Best for: software and retail companies that need to embed white-labeled analytics into their own product or customer portal, not just internal dashboards. It fits mid-size to large organizations with development resources to build on the SDK, and is less suited to single-location retailers.
Implementation: similar to Tableau and Looker. Expect a modeling phase before dashboards or embedded analytics go live, and longer if you're building a white-labeled customer-facing product.
Pros:
- Strong embedded and white-label analytics SDK, a clear differentiator versus Tableau, Power BI, and Looker for customer-facing use cases.
- In-chip query technology allows fast performance on large datasets without a separate warehouse.
Cons:
- Deployment requires a sales conversation rather than self-serve signup, and usage-based billing makes budgeting harder to predict upfront.
- Requires custom data modeling like Tableau and Looker, with no pre-built retail schema.
12. Domo
Domo is a cloud-based BI platform built around broad connectivity: more than 1,000 pre-built connectors, including a dedicated Shopify integration that unifies transactional, customer, inventory, and operational data alongside other retail sources.
Its mobile app lets store managers check dashboards and receive alerts from the sales floor when stock falls below reorder thresholds. Magic ETL and low-code app tools let retail teams build custom dashboards and workflows without heavy engineering support. Domo fits multi-location retailers that want one platform to unify fragmented data sources rather than stitching together several point tools.
Best for: multi-location retailers with fragmented data sources across POS, ERP, ecommerce, and ads that want one platform to unify them rather than a best-of-breed stack. It generally fits once you have enough locations and systems that unifying them by hand has become a burden.
Implementation: faster than most enterprise BI tools thanks to low-code ETL tools and 1,000+ pre-built connectors. The 30-day free trial gives a realistic sense of ramp-up time before committing.
Pros:
- 1,000+ pre-built connectors, among the broadest in this category, which reduces custom integration work.
- Mobile-first design with store-floor alerting, a rare feature among general BI tools.
- 30-day free trial with the full platform and unlimited users.
Cons:
- Credit and consumption-based billing means usage needs active monitoring to avoid surprises, unlike flat per-seat plans.
- Its breadth of features requires investment in governance and data architecture. It isn't a plug-and-play dashboard tool.
13. Qlik
With Qlik Sense, users can explore data through a mix of search, conversational, and augmented analytics. It uses machine learning to suggest correlations, detect anomalies, and predict future behavior.
Qlik's geoanalytics and supply chain dashboards make it a solid option for retailers focused on logistics, real estate, or expansion planning.
Best for: retailers who want to explore data associatively, filtering across tables without pre-built queries, rather than working from fixed dashboards. It scales from smaller teams on the self-serve tier up to large enterprise deployments.
Implementation: associative exploration works quickly out of the box on the self-serve tier, but advanced custom models and joins still require developer time.
Pros:
- The associative engine lets users explore relationships across data ad hoc, without predefining every query path.
- Strong geoanalytics and supply-chain dashboards, useful for expansion and logistics planning.
- 160+ native connectors out of the box.
Cons:
- Cost structure varies significantly between the self-serve tier and enterprise or cloud deployments, so get a detailed quote for your use case before committing.
- Building custom data models and joins for advanced use still requires developer resources.
14. Strategy
Strategy, the retail BI platform long known as MicroStrategy, offers a suite of mobile-first, cloud-ready business intelligence tools. HyperIntelligence embeds contextual insights directly into workflows, so retailers get answers without switching applications.
The platform combines supply chain, inventory, and financial performance analytics for enterprise-level retail chains.
Best for: enterprise retailers that want contextual, in-workflow insights via HyperIntelligence layered on top of existing supply chain and financial systems. It's aimed at larger chains with existing systems to layer insights onto, and is less suited to small independent retailers just starting with analytics.
Implementation: the free trial covers core reporting quickly, but full enterprise rollouts with HyperIntelligence integration across existing systems take considerably longer.
Pros:
- HyperIntelligence surfaces insights inside other apps such as email, CRM, and intranet, rather than requiring a separate dashboard visit.
- Combines supply chain, inventory, and financial analytics in one platform for enterprise retail chains.
- 14-day free trial to test core reporting before a full rollout.
Cons:
- Interface and setup have a steeper learning curve than newer competitors, and can render poorly on smaller screens.
- Implementation for full enterprise deployments takes longer than turnkey retail-specific tools like Datawiz or Shopify Analytics.
Which Platform Fits Your Situation
- Multi-location retail chain wanting one tool for sales, inventory, staff, and merchandising: Datawiz.
- Large enterprise chain (50+ locations, $100M+ revenue) that wants deep pre-built retail metrics and can commit to a multi-month rollout: Oracle Retail Analytics.
- CPG brand selling through major retail and ecommerce partners that needs sell-in/sell-out visibility across accounts: Alloy.ai.
- Selling exclusively on Shopify with zero setup: Shopify Analytics, or Polar Analytics / Triple Whale for deeper omnichannel and attribution reporting.
- On Google Cloud and need governed metrics across many teams: Looker.
- Executives who want answers without writing queries: ThoughtSpot.
- Maximum visualization flexibility with data engineering resources available: Tableau.
- Already standardized on Microsoft 365/Azure: Power BI.
- Embedding analytics into your own product or customer portal: Sisense.
- Fragmented data across POS, ERP, and ads that needs unifying in one platform: Domo.
- Ad hoc, associative data exploration plus supply-chain and geoanalytics: Qlik.
- In-workflow, contextual insights layered onto existing enterprise systems: Strategy.
The right choice depends on store count, tech stack, and how quickly you need the platform live. A 5-location Shopify brand and a 200-location chain need very different things from the same category of software.
How to Choose the Right Retail Data Analytics Solution
Choosing a retail analytics tool comes down to questions about your business that no ranking can answer for you.
- What do you already run, and what will you need to connect? List every system — POS, ERP, CRM, ecommerce, ad platforms — before the first demo. If a platform lacks a native connector for one of them, ask specifically how that gap gets closed and how long it takes.
- Who's going to open this dashboard every day? A natural-language tool suits executives who won't write queries. A drag-and-drop tool suits analysts comfortable with some data modeling. Buying for the wrong skill level is the most common reason dashboards go unused.
- Does the platform fit your store count, or your ambitions? A single-location or small multi-store retailer rarely needs tools built for 50+ locations, because the setup overhead outweighs the benefit. A fast-growing chain on a turnkey tool will hit a customization ceiling sooner than expected.
- What does "real-time" mean for this specific vendor? Some platforms refresh hourly; others stream live. If you plan to act on alerts, confirm the cadence rather than trusting the marketing copy.
- Can you test it against your own data before committing? Some vendors offer full self-serve trials; others go straight to a guided sales demo. If it's a demo, ask to see it running on data similar to yours, not a generic showcase.
- Who owns the data model after launch? If nobody on your team can maintain custom schemas or fix broken connectors once the vendor walks away, a platform that requires ongoing data engineering will degrade over time no matter how good it looked at launch.
- Does the rollout fit your decision calendar? A platform that takes six months to go live won't help with a decision you need to make next quarter. Weigh implementation time against how soon you need answers.
FAQ
What's the difference between a general BI tool like Tableau and a retail-specific platform like Datawiz?
General BI tools are flexible but require significant setup, custom modeling, and technical expertise to produce retail-relevant reports. Retail-specific platforms come with pre-built metrics, category logic, and supplier performance frameworks already embedded, so a category manager can get usable insights on day one without building data models from scratch.
How do I choose retail analytics software if I manage multiple store locations?
Prioritize platforms with chain-level comparison views, centralized data ingestion, and role-based access, so store managers see their store while executives see the full picture. Also verify that the platform handles inventory and sales data at the SKU-and-location level. Aggregate-only reporting masks performance differences between stores that matter for scaling decisions.
Is there a free trial for retail analytics software before committing to a paid plan?
It varies by vendor. Datawiz offers a 14-day free trial with no credit card required, and Domo offers a 30-day free trial with the full platform. Most enterprise platforms (Oracle Retail Analytics, Looker, Sisense, ThoughtSpot) don't offer self-serve trials, so expect a guided demo instead. When evaluating any trial, connect your own POS data in the first 48 hours. Platforms that require weeks of data ingestion before showing meaningful insights have a longer time-to-value that affects real implementation timelines.
Do retail analytics platforms send automated purchase or replenishment alerts?
Some do, some don't, so check per vendor rather than assuming. Datawiz BI includes automated reorder point monitoring tied to actual stock levels and demand forecasts. Oracle Retail AI Foundation and Polar Analytics both send real-time alerts for stock or performance dips. Ask vendors whether alerts are rule-based (fixed threshold triggers) or demand-driven (based on forecasted depletion rates). Demand-driven alerts tend to be more accurate for seasonal and promotional categories.
Do I need a data warehouse to use retail analytics software?
It depends on the platform. Turnkey platforms (Datawiz, Shopify Analytics, Domo) include their own data storage, so no separate warehouse is needed. Visualization-first platforms (Tableau, Power BI, Looker, Qlik) generally expect you to already have a data warehouse such as Snowflake, BigQuery, or Redshift, where your data is prepared before it's visualized. Factor that setup time in separately from the software itself.
What's the difference between retail analytics software and my POS system's built-in reports?
POS-native reports are usually limited to what happened at that specific point of sale: sales totals, basic inventory counts, receipt-level data. Retail analytics platforms pull data from multiple systems — POS, ecommerce, loyalty, marketing — into one place, which enables cross-channel views such as which promotion drove incremental sales, or how one store compares to the chain average. If you run one till and one channel, built-in POS reporting may be enough. The case for dedicated analytics software gets stronger as you add locations or sales channels.

Make decisions based on real data with Datawiz BI


 No credit card required