RECOMMENDED ASSORTMENT
Laboratory - AI-based reports module on Datawiz BI service
The "Recommended assortment" report is an experimental report that analyzes the sales of products by chain stores and recommends products that are appropriate to introduce into the assortment of individual stores.
The functionality of the report allows to:
- identify products that are appropriate to introduce into the assortment of individual stores;
- predict product sales using recommendations;
- increase the chain's profit by choosing the most effective assortment policy.

To generate recommendations, the algorithm analyzes the sales of each store for the last 30 days from the last date for which the data is uploaded into the service, and then clusters the stores (groups them).
Clustering is based on category sales. Those stores that have similar demand for the same product categories fall into one cluster (one group).
In the next step, the algorithm analyzes each cluster separately and determines which products are sold in some stores in the cluster but not in others. These are the products that are included in the list of recommended products for introduction into the assortment.
For example, the cluster includes 10 stores. 8 of them sell product X, which is not sold in the other 2. The algorithm will recommend introducing product X to those 2 stores where it is not sold.
Further, machine learning algorithms predict the sales, profit, and sales qty that can be received by accepting the report's recommendations.

At the top there are information cards that display general data on recommendations, namely:
- Predicted sales of recommended products for 30 days
- Predicted profit of recommended products for 30 days
- Predicted sales qty of recommended products for 30 days
- Number of recommended products
- Number of stores with recommendations
Below is a table that displays all the current recommendations generated by the algorithm as of the last date when data was loaded on the service.
Evaluation of reports
The main goal of creating the "Laboratory" section is to get feedback (rating and / or recommendations) from users and improve new reports in according to the current needs of retailers.
To do this, there is a column "Please evaluate the forecast" for each product/store in the experimental reports. It contains two buttons:
-
Like - a click paints the button and indicates that the forecast is realistic, and the user likes it;
-
Dislike - a click paints the button and indicates that the user has doubts about the accuracy of the forecast.
Clicking on any evaluation button opens a window, where the user can leave a comment or recommendation to improve the calculation.
Your expertise will help us get better.
Metrics
In the columns you can choose the metrics required by the user to generate a report. All metrics are divided into subgroups:
Receipt Qty
Stocks
Availability
Assortment activity
Laboratory
- Please rate the forecast
- Predicted sales
- Avg sales on similar stores
- Predicted sales qty
- Avg Sales Qty on similar stores
- Predicted profit
- Avg Profit of on similar stores
- Predicted margin, %
To quickly find the necessary dimensions, enter the first letters/symbols of the dimension name in the search field. The search works automatically, leaving all found matches in the table.
To reset the search results, click on the cross in the search field.
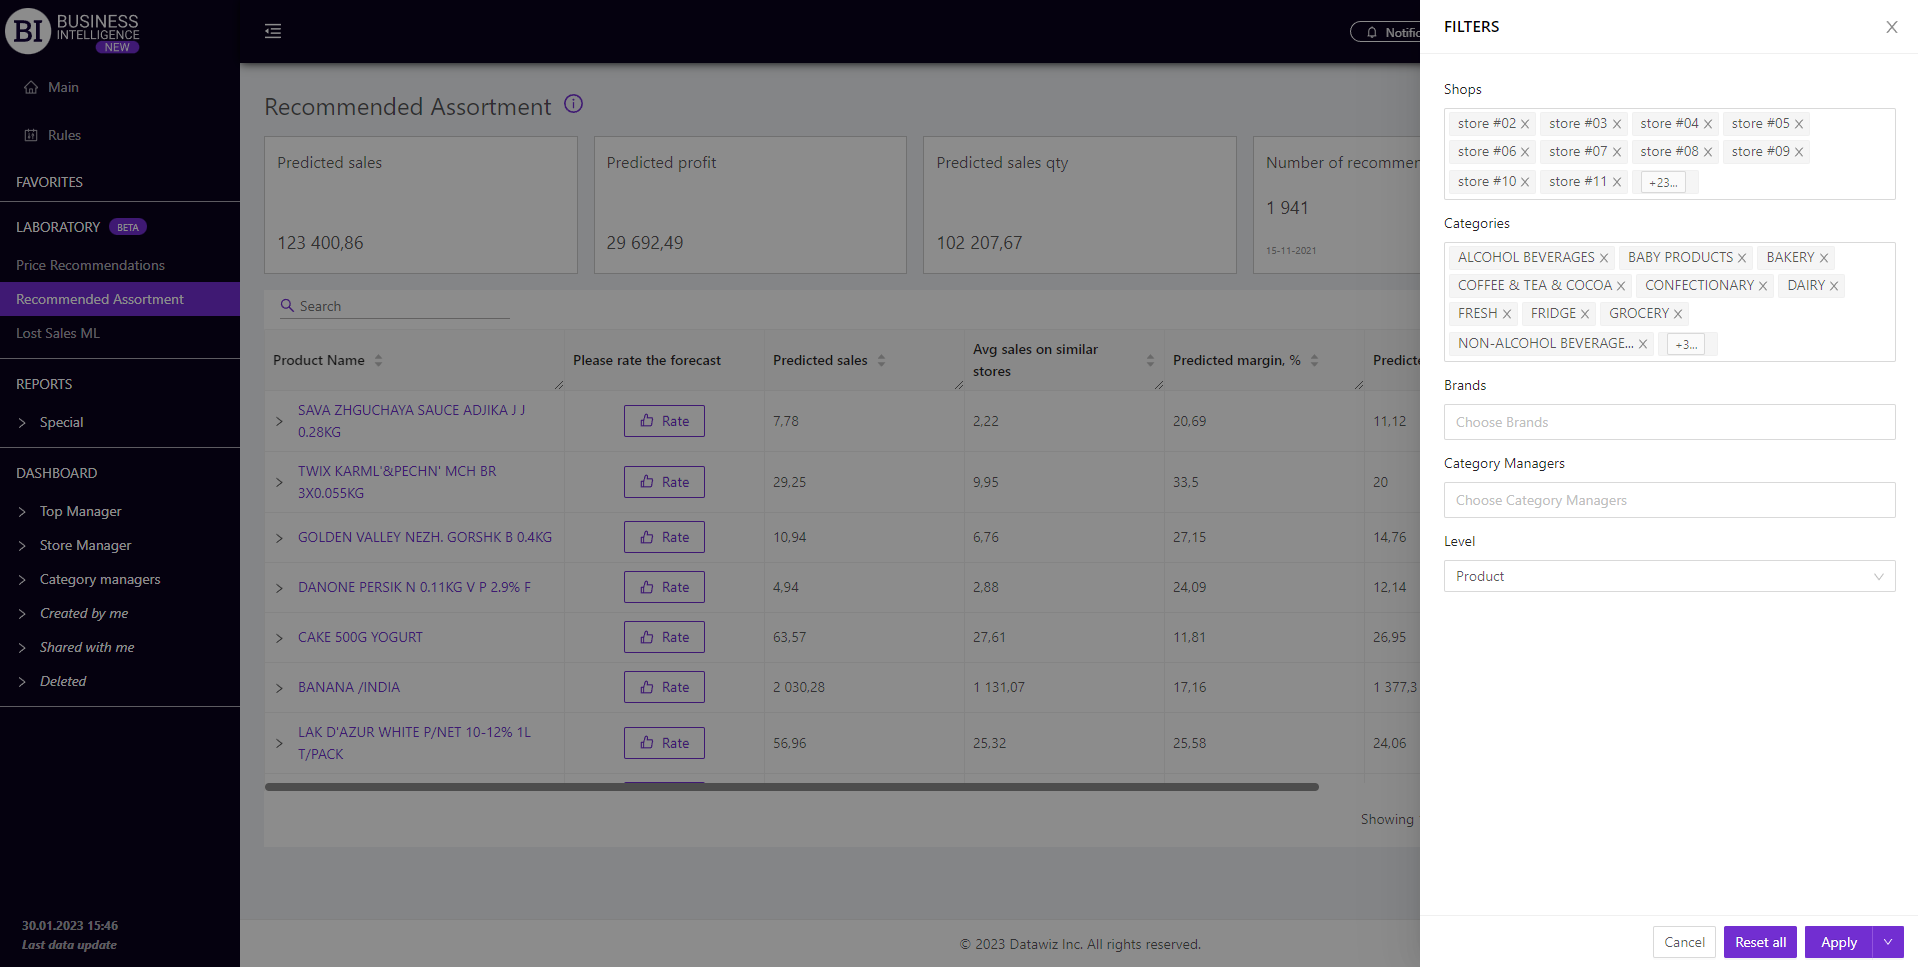
Filters
The selection of filters makes it possible to carry out the analysis within the specified conditions.
On the right side of the report you can open a modal window with the following filters:
- Stores
- Categories
- Products
- Brands
- Category managers
- Level
- Product
- Store