Best Examples of BI Dashboards For Retail
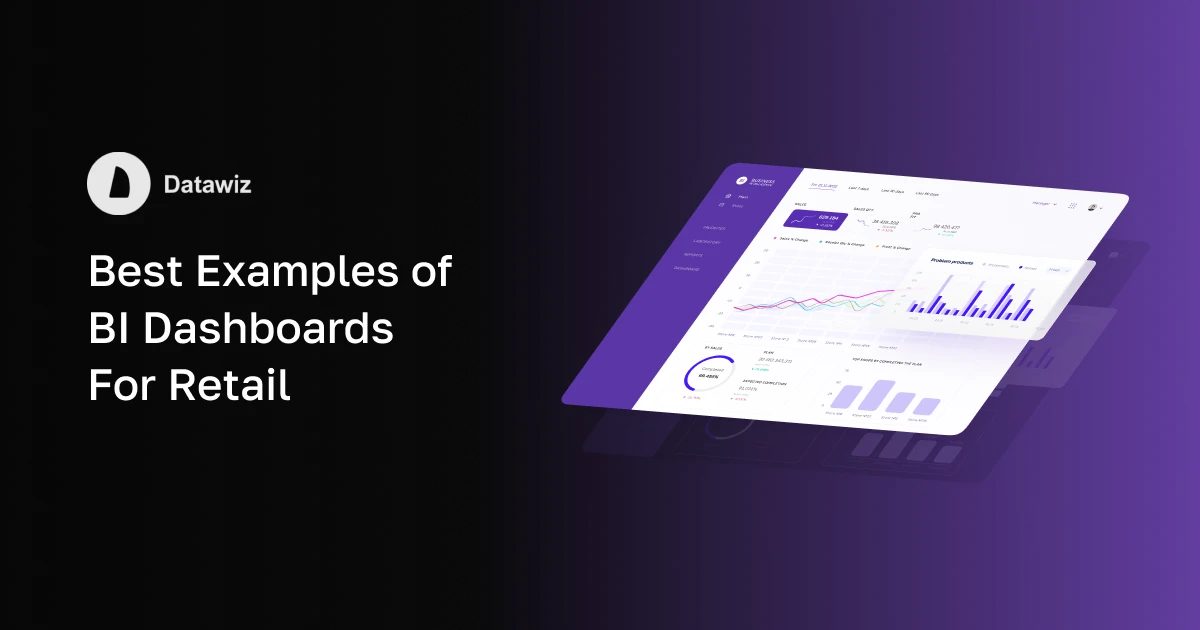
BI dashboards have become an integral part of retail analytics, allowing businesses to make quick, data-driven decisions. They provide key information on sales, inventory, marketing campaign effectiveness, and other aspects of store chain management.
Examples of BI Dashboards For Retail:
- Key Network KPIs - provides an overview of key performance indicators such as gross profit, revenue, average receipt and margin.
- Store Performance- allows you to analyze the performance of shops, identifying leaders and outsiders.
- Product Category Analysis - helps identify the most profitable product groups and manage assortment.
- Marketing analysis - assesses the impact of promotions, discounts and loyalty programs on sales and profits.
- Supplier collaboration - helps assess supplier reliability, supply terms and conditions and their impact on profitability.
Top BI Tools For Retail Analytics
BI tools allow retailers to gain valuable insights, automate data analysis and visualize key metrics. Let's take a look at the most popular solutions on the market.
1. Tableau
Tableau is one of the leaders among BI platforms, offering powerful data visualization and analysis tools. Key features:
- Interactive dashboards with extensive customization capabilities.
- Support for multiple data sources (SQL, Excel, cloud services).
- Automatic report updates and the ability to work together.
2. Power BI
Microsoft's Power BI is a powerful analytics tool that integrates with other goods in the Office 365 ecosystem. Features:
- Easy to use and integration with Excel, SharePoint, and Azure.
- Advanced automation and data update capabilities.
- Use of DAX language for complex calculations.
3. Qlik
Qlik offers analytical solutions with an associative data model, allowing you to explore relationships without preparing data in advance.
- QlikView - classic version for creating reports and dashboards.
- Qlik Sense is a more modern platform with advanced visualization capabilities.
4. Klipfolio
Canadian service Klipfolio offers flexible tools for building BI dashboards in real time:
- Support for integration with Google Analytics, Salesforce, SQL and other services.
- Create custom visualizations with pre-defined templates.
- Ability to work together and quickly customize to meet business objectives.
5. Datawiz BI
Datawiz BI is a specialized BI solution for retail that allows you to analyze data in real time.
- Automation of business processes of retail chains.
- Flexible visualization tools and personalized dashboards.
- Built-in algorithms for forecasting and analyzing key indicators.
KPIs For BI Dashboard in Retail: What to Include?
Choosing the rightKPIs(key performance indicators) plays a crucial role in evaluating and managing your business. In retail, the following metrics are important:
- Gross margin on inventory investment (GMROI) - a measure of inventory profitability.
- Sales per square meter - helps to evaluate the efficiency of retail space utilization.
- Average Transaction Value (ATV) - shows how much a customer spends on average per purchase.
- Inventory turnover - a key indicator of inventory management.
- Visitor-to-buyer conversion - shows how effective marketing and sales strategies are.
How to Create a BI Dashboard For Retail in Datawiz BI
The process of creating a BI dashboard inDatawiz BIinvolves several steps:
1. Generating a Sample of Data
Drag-and-drop technology is used, which allows you to quickly collect the necessary data and filter it by various parameters.
2. Setting Up Visualization
The platform provides 17 types of visualizations that can be adapted to business tasks by changing colors, captions, axes and data sorting.
3. Placement of Elements on the Dashboard
Allows you to organize visualizations in a convenient way, resize and add filters for in-depth analysis.
Datawiz BI offers an intuitiveDashboards Builderthat allows users without deep technical knowledge to create informative and visual dashboards. Key benefits:
- Easy customization: Flexible interface with drag-and-drop widgets and filter customization.
- Adaptability: Dashboards can be customized for any business tasks - from sales analysis to inventory management.
- Deep analytics: The ability to combine data from different sources and generate multi-dimensional reports.
Data Visualization for Retailers
Data visualization helps retailers quickly analyze complex metrics and make decisions based on relevant information. Key benefits:
- Rapid monitoring - enables rapid response to business changes.
- Identify trends - helps discover patterns and adjust strategies.
- Simplified communication - facilitates information sharing between departments and employees.
- KPI customization - the ability to adapt indicators to specific stores or product categories.
How Does BI Analytics Help You Make Decisions?
- Optimize pricing policy - analyzing prices and sales helps determine optimal markup levels.
- Cost reduction- BI analytics identifies problem areas of expenses.
- Forecasting profitability - forecasting models help predict future sales.
- Inventory control - analyzing product turnover reduces the risks of excess inventory.
Using BI tools in retail offers significant benefits by automating data collection, visualizing critical metrics, and improving planning. Interactive BI dashboards help retailers quickly track KPIs, analyze sales, and improve network profitability. Choosing the right BI solutions such as Datawiz BI, Power BI, Tableau or Qlik can significantly improve business performance and make analytical processes more convenient and accessible
 Co nowego?


 Nie potrzebna karta bankowa!