

Last updated: October 6, 2026
What is Retail Sales Analysis
Retail sales analysis is a set of activities to assess the quality of decisions made and to correct problems in the sales process in order to increase profits. Sales data is a key input for analyzing shop performance.
The role of sales analysis in business development
Sales analysis is a strategically important tool for assessing a company's level of development relative to the market. With the help of sales analysis it is possible to:
- Assess the efficiency of the shop and its managers.
- Make decisions that contribute to an increase in sales performance.
- Make clear forecasts on product sales processes.
Basic Methods of Sales Analysis
There are a number of ways to analyze shop sales according to different criteria. Each individual method allows you to evaluate the effectiveness of the shop strategies used from one angle or another. Let's take a look at the most popular ones.
ABC Analysis
This research method allows you to create a shop goods classification and determine the profitability of items by category. The ABC-sales analysis method uses the Pareto 80/20 principle. The classification of the objects of analysis depends on its objectives and is divided into 3 groups:
- Group A. The items with the highest profits (80% of the profits from sales of 20% of the range).
- Group B. Goods with stable average demand.
- Group C. The category of goods with the lowest profitability.
XYZ Analysis
The data from XYZ analysis demonstrates the uniformity of demand, a key parameter in optimizing the range of retail products in the retail chain. The goods are grouped according to the coefficient of variation:
- Group X. Goods with a coefficient of variation of 0 to 10%. This indicates stable demand that doesn't change by more than 10% per month.
- Group Y. Goods with a coefficient of variation of 10 to 25%.
- Group Z. Goods with the least predictable demand, a variation of more than 25%.
Fluctuating demand shows the value of a particular product group in terms of profitability and gives greater insight into the realism of sales targets.
Determining Profitability
Profitability is a measure of a company's profitability, the economic efficiency of the funds invested.
Formula: Return on sales = Profit on sales ÷ Revenue
Important: large revenues do not equal large profits. A loss-making business is the object of a tax audit.
The XYZ method of sales analysis emphasizes the economic aspect of sales. A negative result of dividing net profit by revenue tells you that you are operating at a loss.
Analysis of Sales Dynamics
Sales dynamics is the change in the sales performance of one period compared to previous periods. Sales dynamics analysis is an assessment of the change in sales (turnover) over time. The method allows you to understand how much revenue has changed compared to the previous period. The indicators used for the analysis are:
- Change in turnover = Turnover for the current period − Turnover for the previous period
- Turnover growth rate, % = (Current period turnover ÷ Last period turnover) × 100%
- Turnover rate, % = Turnover growth rate, % − 100%
Example: The shop's turnover in January was 200 thousand UAH and in February it was 180 thousand UAH.
- Change in turnover = 180 − 200 = −20 thousand UAH
- Turnover growth rate, % = (180 ÷ 200) × 100% = 90%
- Turnover rate, % = 90 − 100 = −10%
In February, turnover fell by 10% compared to January. This negative situation calls for a detailed factor analysis to determine the reasons for the slump.
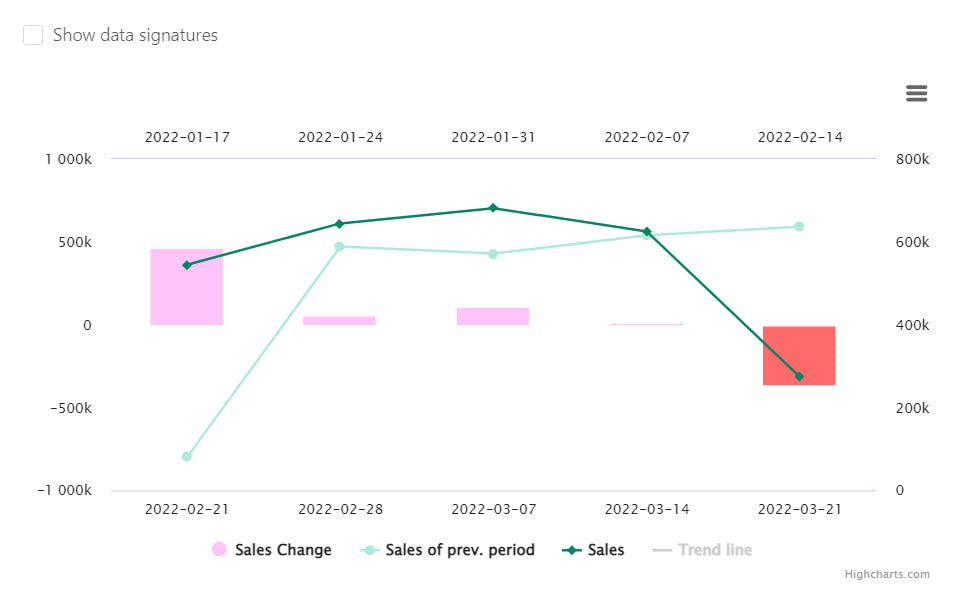
Chronology of changes in indicators helps infer the speed of a company's development and trends in demand. As with determining profitability, the dynamics of sales are calculated using the formula:
Dynamics = (Sales for the reporting period ÷ Sales for the previous period) × 100%
BCG Matrix Analysis
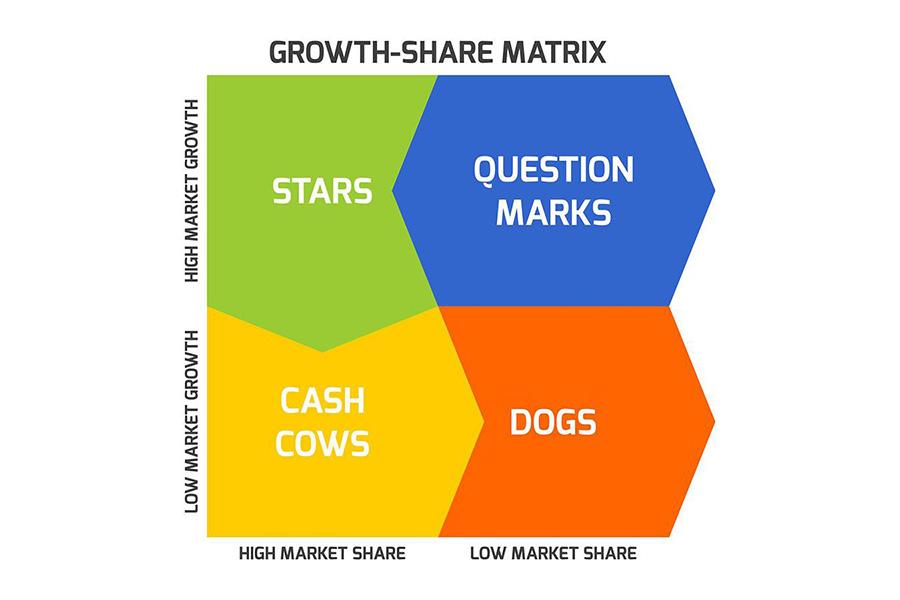
The creative approach to product segmentation by profitability, invented by Bruce Henderson, hasn't lost its effectiveness to date. The purpose of this method is to analyze the relevance of products in relation to demand growth. We cover this matrix in more detail in our dedicated guide on the BCG matrix for retail.
Plan Fulfillment Analysis
This method allows you to understand the extent to which the shop has achieved its sales targets, meaning the extent to which the plan has been fulfilled or under-fulfilled.
Formula: % of turnover plan fulfillment = (Turnover actual ÷ Turnover plan) × 100%
If the value is ≥ 100%, the plan has been met or exceeded. If it is < 100%, the plan is under-implemented and the reasons for this negative situation should be investigated. This indicator can be calculated for individual products, categories, shops, or category managers, and analyzed not only in terms of turnover but also other indicators: profit, average receipt, margin, and so on.
Example: The sales plan for February was 220,000 UAH and the actual turnover was 180,000 UAH.
% of turnover implementation = (180 ÷ 220) × 100% = 81.8%
The turnover plan for February was 18.2% short of its target. This may be a critical situation for the chain, and it's worth understanding what caused it so the causes can be addressed.
The results of plan execution analysis allow timely adjustments to be made when actual and planned sales diverge.
Factor Analysis of Sales
Using the results of factor analysis, it's possible to clearly identify specific factors affecting the sales of goods. Among the most common are:
- Fluctuating sales volume.
- The dynamics of the range of goods sold.
- The impact of changes in production costs.
- Changes in selling prices of products.
The results of sales factor analysis show the maximum possible ways of increasing profits. It's best to compare two periods: the current period and the previous one.
Structure of the Receipt
This is a point method of retail sales analysis, used for SKU analysis: how many and which specific items are sold in one shop.
Formula: Average SKUs per receipt = Sum of SKUs sold to each outlet ÷ Total number of outlets
Analysis of the receipt structure also allows the effectiveness of the relationship between turnover and merchandising to be traced. It's most effective in large retail chains, and useful alongside market basket analysis.
Using Data Visualization Tools
The more data from different sources you analyze, the more difficult it becomes to assess objectively. Data visualization makes it much easier to interpret and make sense of that information. Modern BI platforms like Tableau, Power BI, and Datawiz BI all build on this principle: fast data collection and processing that allows the results of a wide variety of metrics to be compared, with the results converted into visual dashboards to help make management decisions quickly.
Tips for Data Analysis
- A focus on internal indicators. The success of data analysis can be measured not only by impressive revenue figures, but also by better KPI implementation by departmental managers and, as a result, the efficiency of business processes. If in doubt when making a decision, analyze possible risks using the SWOT method.
- Updating marketing data. Sales analysis is recommended on a regular basis. The quicker you react to changes in customer preferences, the more profitable your sales business will be.
- Refinement of the sales plan. The influence of external factors (promotions, merchandising, advertising campaigns) can influence the sales plan both positively and negatively. Monitor the impact of such specific instruments on a short time frame.
FAQ
Which sales analysis method should a retailer start with?
ABC analysis is the most practical starting point for most retailers, since it immediately shows which 20% of products are driving 80% of profit. XYZ analysis is the natural next step once ABC is in place, as combining the two tells you not just which products matter most, but how predictable their demand is.
How often should sales analysis be performed?
Sales dynamics and plan fulfillment are worth reviewing weekly or monthly, since they're meant to catch problems early. ABC and XYZ classification changes more slowly and is typically reviewed quarterly, though fast-moving categories may warrant a monthly refresh.
What's the difference between sales dynamics and plan fulfillment analysis?
Sales dynamics compares current performance against a previous period, so it tells you whether things are improving or declining relative to the past. Plan fulfillment compares actual performance against a target set in advance, so it tells you whether the business is on track relative to its own goals. A chain can show positive dynamics while still falling short of plan, or vice versa.
Can these methods be applied to a single store, or only to a whole chain?
All of the methods described here work at the individual store level, the category level, or the full chain level. Receipt structure and factor analysis tend to be most informative at the chain level, where there's enough volume to spot patterns, while plan fulfillment and sales dynamics are useful to track at every level at once.

Make decisions based on real data with Datawiz BI


 No credit card required