Modern retail is actively changing under the influence of technology, and one of the key trends is the use of business intelligence to optimize processes. In this context, BI systems such as Datawiz BI have become indispensable tools for data management in retail, enabling businesses to make accurate and timely decisions.
What is Business Intelligence and Why is it Important?
Business Intelligence (BI) is software that collects, processes, analyzes, and presents data in an understandable way. With BI, companies can turn chaotic amounts of information into structured reports, graphs, charts and interactive dashboards. In the past, BI systems were only available to large companies, but today, platforms likeDatawiz BImake analytics accessible to businesses of all sizes.
Key benefits of Datawiz BI:
- Single ecosystem: Once integrated, the user has access to a full range of analytics solutions without the need for additional customization.
- Retail Specialization: The platform contains out-of-the-box reports and templates that perfectly match the needs of retailers.
- Speed and Scalability: Can process millions of transactions daily, providing real-time data critical for fast decision making.
- Demo: Customers can try out the functionality for 14 days for free, allowing you to evaluate the effectiveness of the product before implementation.
BI Data Visualization Examples
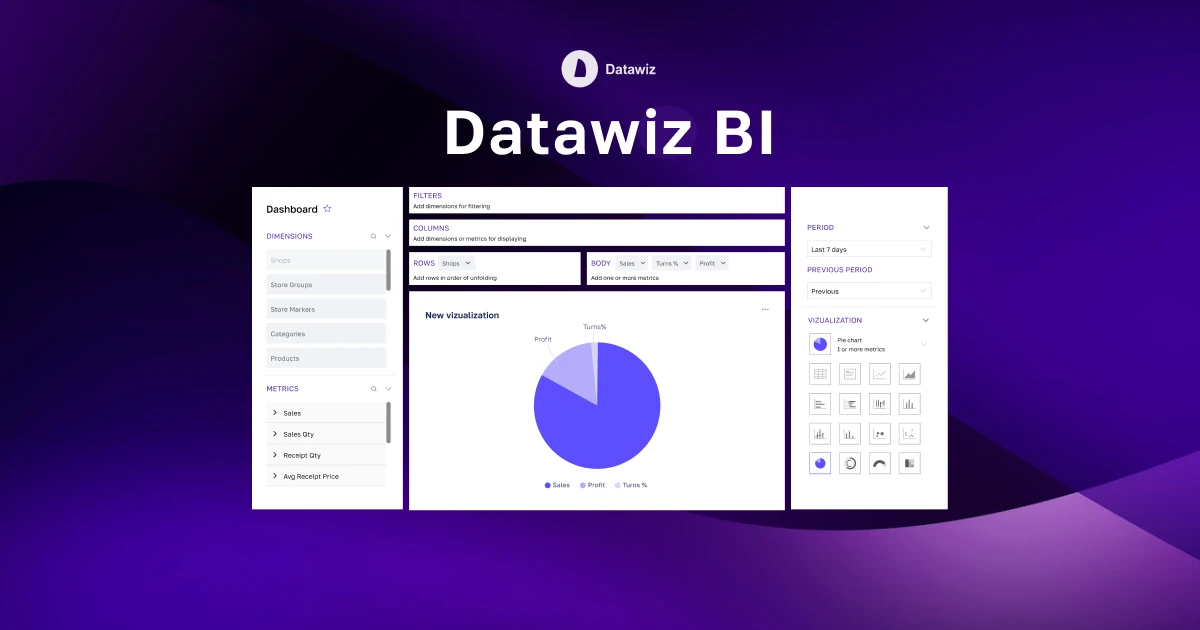
Data visualization is an art that turns complex numerical metrics into an understandable form. Datawiz BI provides a wide range of visualization tools to help users perceive information intuitively.
Popular visualization methods:
- Graphs: Line graphs, bar graphs, pie charts to compare trends.
- Charts: Pyramidal, scatter, or combination charts for detailed analysis.
- Cartograms: Display geographic information such as sales by region.
- Interactive Storytelling: Comprehensive presentations that combine text and graphics.
- Diagrams: To display logistical or process relationships.
- Tables: For in-depth analysis of numerical data: For in-depth analysis of numerical data with filtering.
- Cards: Used to showKPIsor short summaries.
With these methods, users can not only see current metrics, but also understand the big picture, identify patterns, and evaluate performance.
What is a Dashboard in BI?
A BI dashboard is an interactivedata visualization toolthat allows you to combine large amounts of information into a comprehensible and easy-to-analyze view. With BI dashboards, users can track key performance indicators (KPIs) in real time, analyze trends, and identify weaknesses in processes. They combine intuitive design with powerful data processing algorithms, making them indispensable for retail data management.
For example, a dashboard can show data on sales volumes in different regions, the effectiveness of promotions or the performance of individual stores. In this way, managers get a comprehensive view of the state of the business, which facilitates rapid decision-making.
The Main Scenarios for Using Dashboards in the Retail Industry
Datawiz BI offers a wide range of templates and reports to help retailers achieve better results.
The availableDashboards Buildertool allows you to create unique BI dashboards for any need:
- Category Management Dashboard: Helps to adjust assortment by analyzing sales of products in different categories.
- Marketing Activity Dashboard: Displays the results of loyalty programs and promotions.
- Supplier Collaboration Dashboard: Monitors supplier performance to ensure optimal inventory management.
- Shared Network KPI Dashboard: Allows you to track key metrics such as sales volume, profitability and plan fulfillment.
- Store Performance Dashboard: Analyzes the performance of individual stores and their employees.
How Datawiz BI Contributes to Retail Data Management
Datawiz BI offers everything you need to effectively manage data in retail, from integrating transactional data to generating forecasts and recommendations. For example, by automating analytics processes, you can quickly find out which goods are in demand and which require additional promotions.
Integration allows retailers to quickly adapt to market changes, leverage best practices in data management, and turn complex numbers into powerful tools for growth.
Datawiz BI business intelligence software is a comprehensive ecosystem that maximizes retail results
 Co nowego?


 Nie potrzebna karta bankowa!