 Novedades

Modern retail requires detailed analysis of sales data to improve business profitability and optimize the product matrix. One of the key analytics tools are ABC and XYZ analyses, which allow not only to categorize products by importance and profitability, but also to assess the stability of demand.
What is ABC and XYZ analysis?
ABC Analysis: Segmentation of Goods by Importance
ABC analysis divides assortments into three groups based on their contribution to total turnover or profit:
- Group A - goods that generate 80% of revenue. They require special attention as they are key to the business.
- Group B - merchandise with an average contribution (15% of turnover). They are important but not critical.
- Group C - items that contribute only 5% of revenue. They should be analyzed for withdrawal from the assortment or adjustment of purchases.
XYZ Analysis: Assessing the Stability of Demand
XYZ-analysis helps to understand how stable the demand for a product is:
- Group X - items with predictable sales and low variability. Such items can be purchased in advance.
- Group Y - average stability of demand, seasonal fluctuations are possible.
- Group Z - goods with chaotic demand. It is difficult to forecast them, so it is important to monitor the dynamics and adjust purchases.
ABC and XYZ Cross-Analysis: How to Combine Both Methods
Joint ABC/XYZ analysis allows you to categorize goods by their importance and stability:
- AX group - key merchandise with high and stable sales. They must always be in stock.
- AY group - profitable, but with moderate variability of demand. It is important to take seasonal fluctuations into account.
- AZ group - highly profitable, but their demand is unstable. A flexible purchasing strategy is required.
- CZ group - unprofitable items with unstable demand. They are worth revising or replacing.
- CX group - low demand items but stable. They should be optimized.
- CY group - low-margin goods with unstable sales. It is worth revising the sales or marketing strategy.
- BY group - products with average contribution to revenue but seasonal stability.
- BX group - medium revenue contributors with stable sales. Should be in stock but in limited quantities.
- BZ group - medium yield items with unpredictable demand. Requires a customized approach.
This analysis helps retailers optimize inventory, improve pricing and reduce losses.
Example of Using ABC and XYZ Analysis
Let's imagine that a supermarket chain is analyzing its product assortment. The result of the analysis is:
- 3.2% fat milk falls into the AX category - it must always be kept in stock.
- Exotic fruits such as passion fruit fall into the CZ category - can be ordered in small batches or excluded from the assortment.
- New Year's sweets are in the BY group - demand varies with the season, so stock should be increased before the holidays.
How Often to Conduct ABC and XYZ Analysis of Product Categories?
The recommended frequency of analysis depends on the type of business:
- Retail chains and supermarkets - once every 3-6 months, as assortment and demand change quickly.
- Specialized stores - once every 6-12 months, as the nomenclature is more stable.
- E-commerce - quarterly or more often, as online sales depend on marketing activities and seasonality.
Regular analysis allows you to timely identify changes in demand, adjust the assortment and improve product turnover.
How to Use the Results of ABC/XYZ Analysis?
The results of the analysis can be applied in various spheres of retailing:
- Assortment optimization - adjusting purchase volumes based on product importance and stability.
- Warehouse management - allocation of space for key products, reduction of low-liquidity items.
- Promotions anddiscounts- formation of marketing campaigns based on ABC/XYZ categories.
- Pricing - raising prices for stable goods and adjusting prices for group Z.
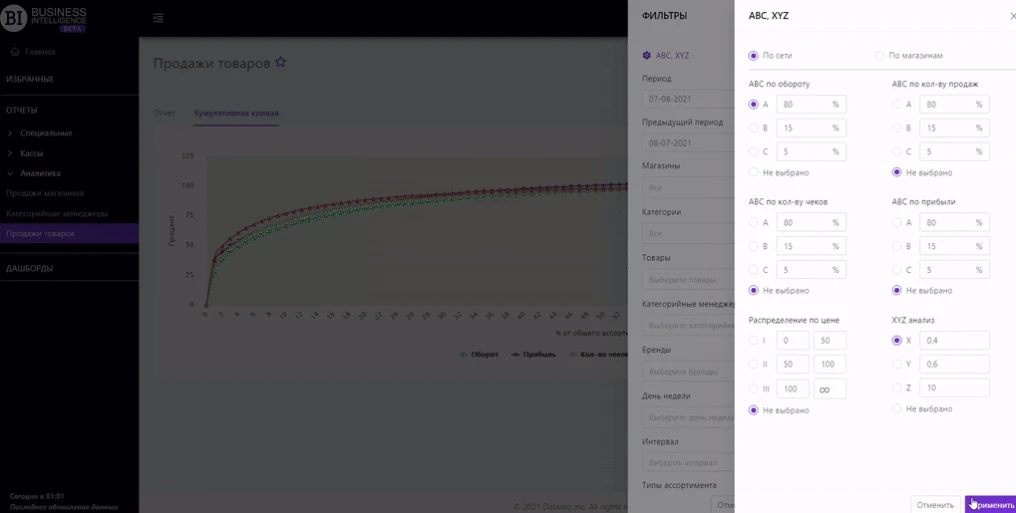
How will Datawiz Help in ABC and XYZ-analysis of Goods?
Datawiz service offers BI reports that allow you to quickly and efficiently analyze sales and perform ABC/XYZ analysis.
“Product Sales” report
This report shows detailed statistics for each nomenclature item. With its help you can:
- Examine the structure of the assortment.
- Identify the most profitable products.
- Conduct ABC and XYZ-analysis.
This report allows you to make timely decisions on the withdrawal or expansion of the assortment, which helps to increase the profitability of the network.
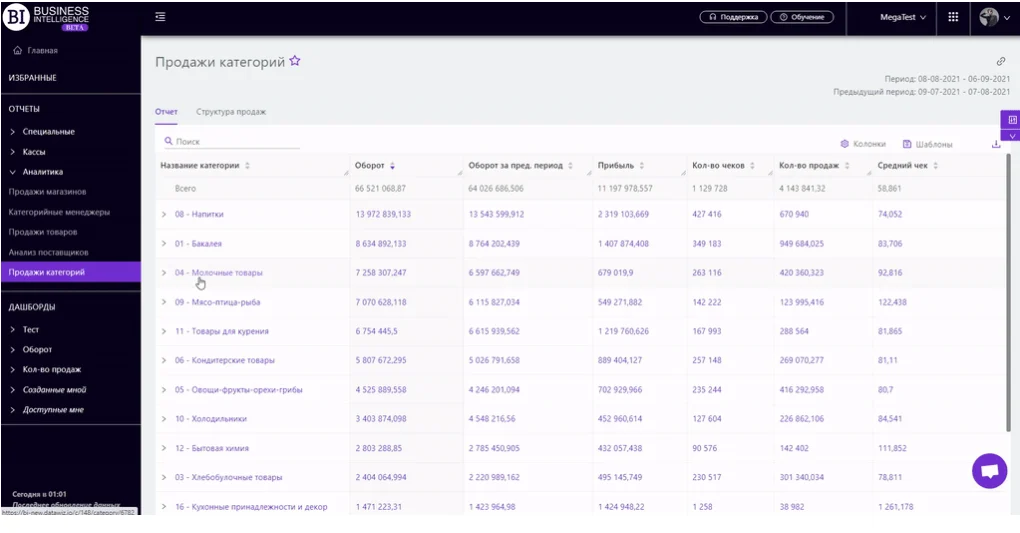
“Category Sales” report
The report is designed to analyze key sales indicators in the context of product categories. It allows you to:
- Track sales dynamics.
- Analyze product groups, going down to the SKU level.
- Visualize the structure of turnover and balances.
Benefits of using Datawiz:
- Automatic real-time data updates.
- Convenient graphs and analytics for quick interpretation of results.
- Flexible settings for adapting the analysis to specific business tasks.
As retailing grows, assortment management and sales analysis are becoming increasingly complex. If in a small store the owner could control deliveries, sales and interaction with customers on his own, in modern conditions it is impossible to do without analytical tools. ABC and XYZ-analysis are key tools for assortment management in retail. They help identify profitable products, optimize inventory and develop sales strategies. However, effective analysis requires modern BI solutions such as Datawiz BI.


 ¡No se necesita tarjeta bancaria!