 Novedades
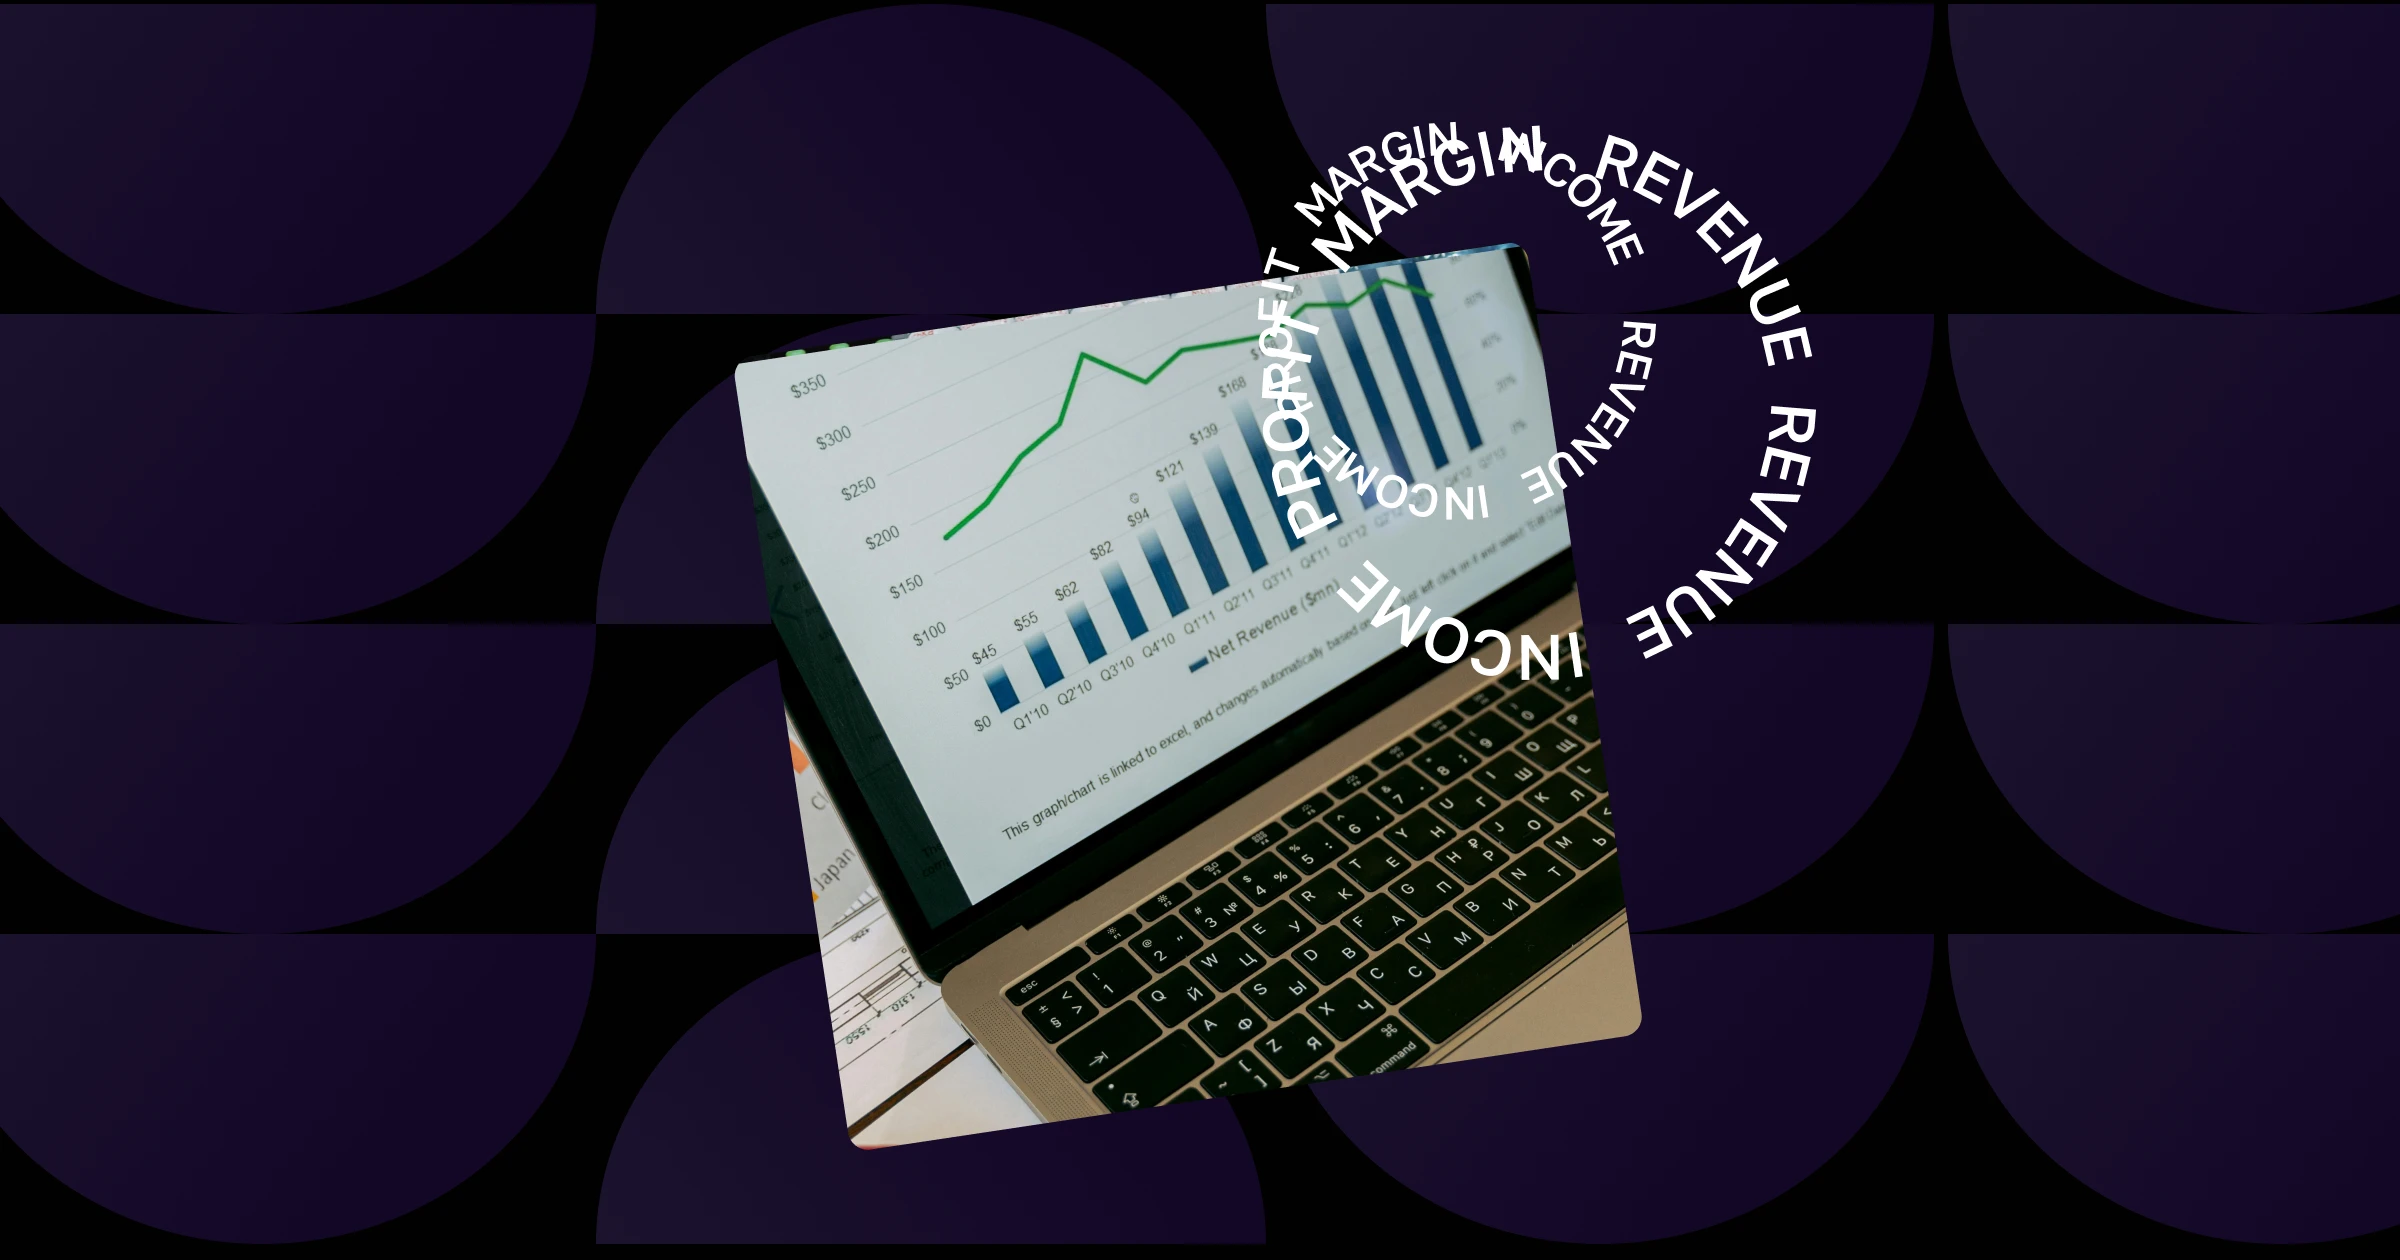

What is Advanced Analytics?
Advanced analytics is a data analysis approach that goes far beyond standard reports and descriptive dashboards. While basic analytics answers the question “what happened?”, advanced analytics seeks to explain “why did it happen, what’s next, and what can we do about it?”. It combines statistical modeling, machine learning, predictive algorithms, and optimization techniques to help businesses make more accurate and data-driven decisions.
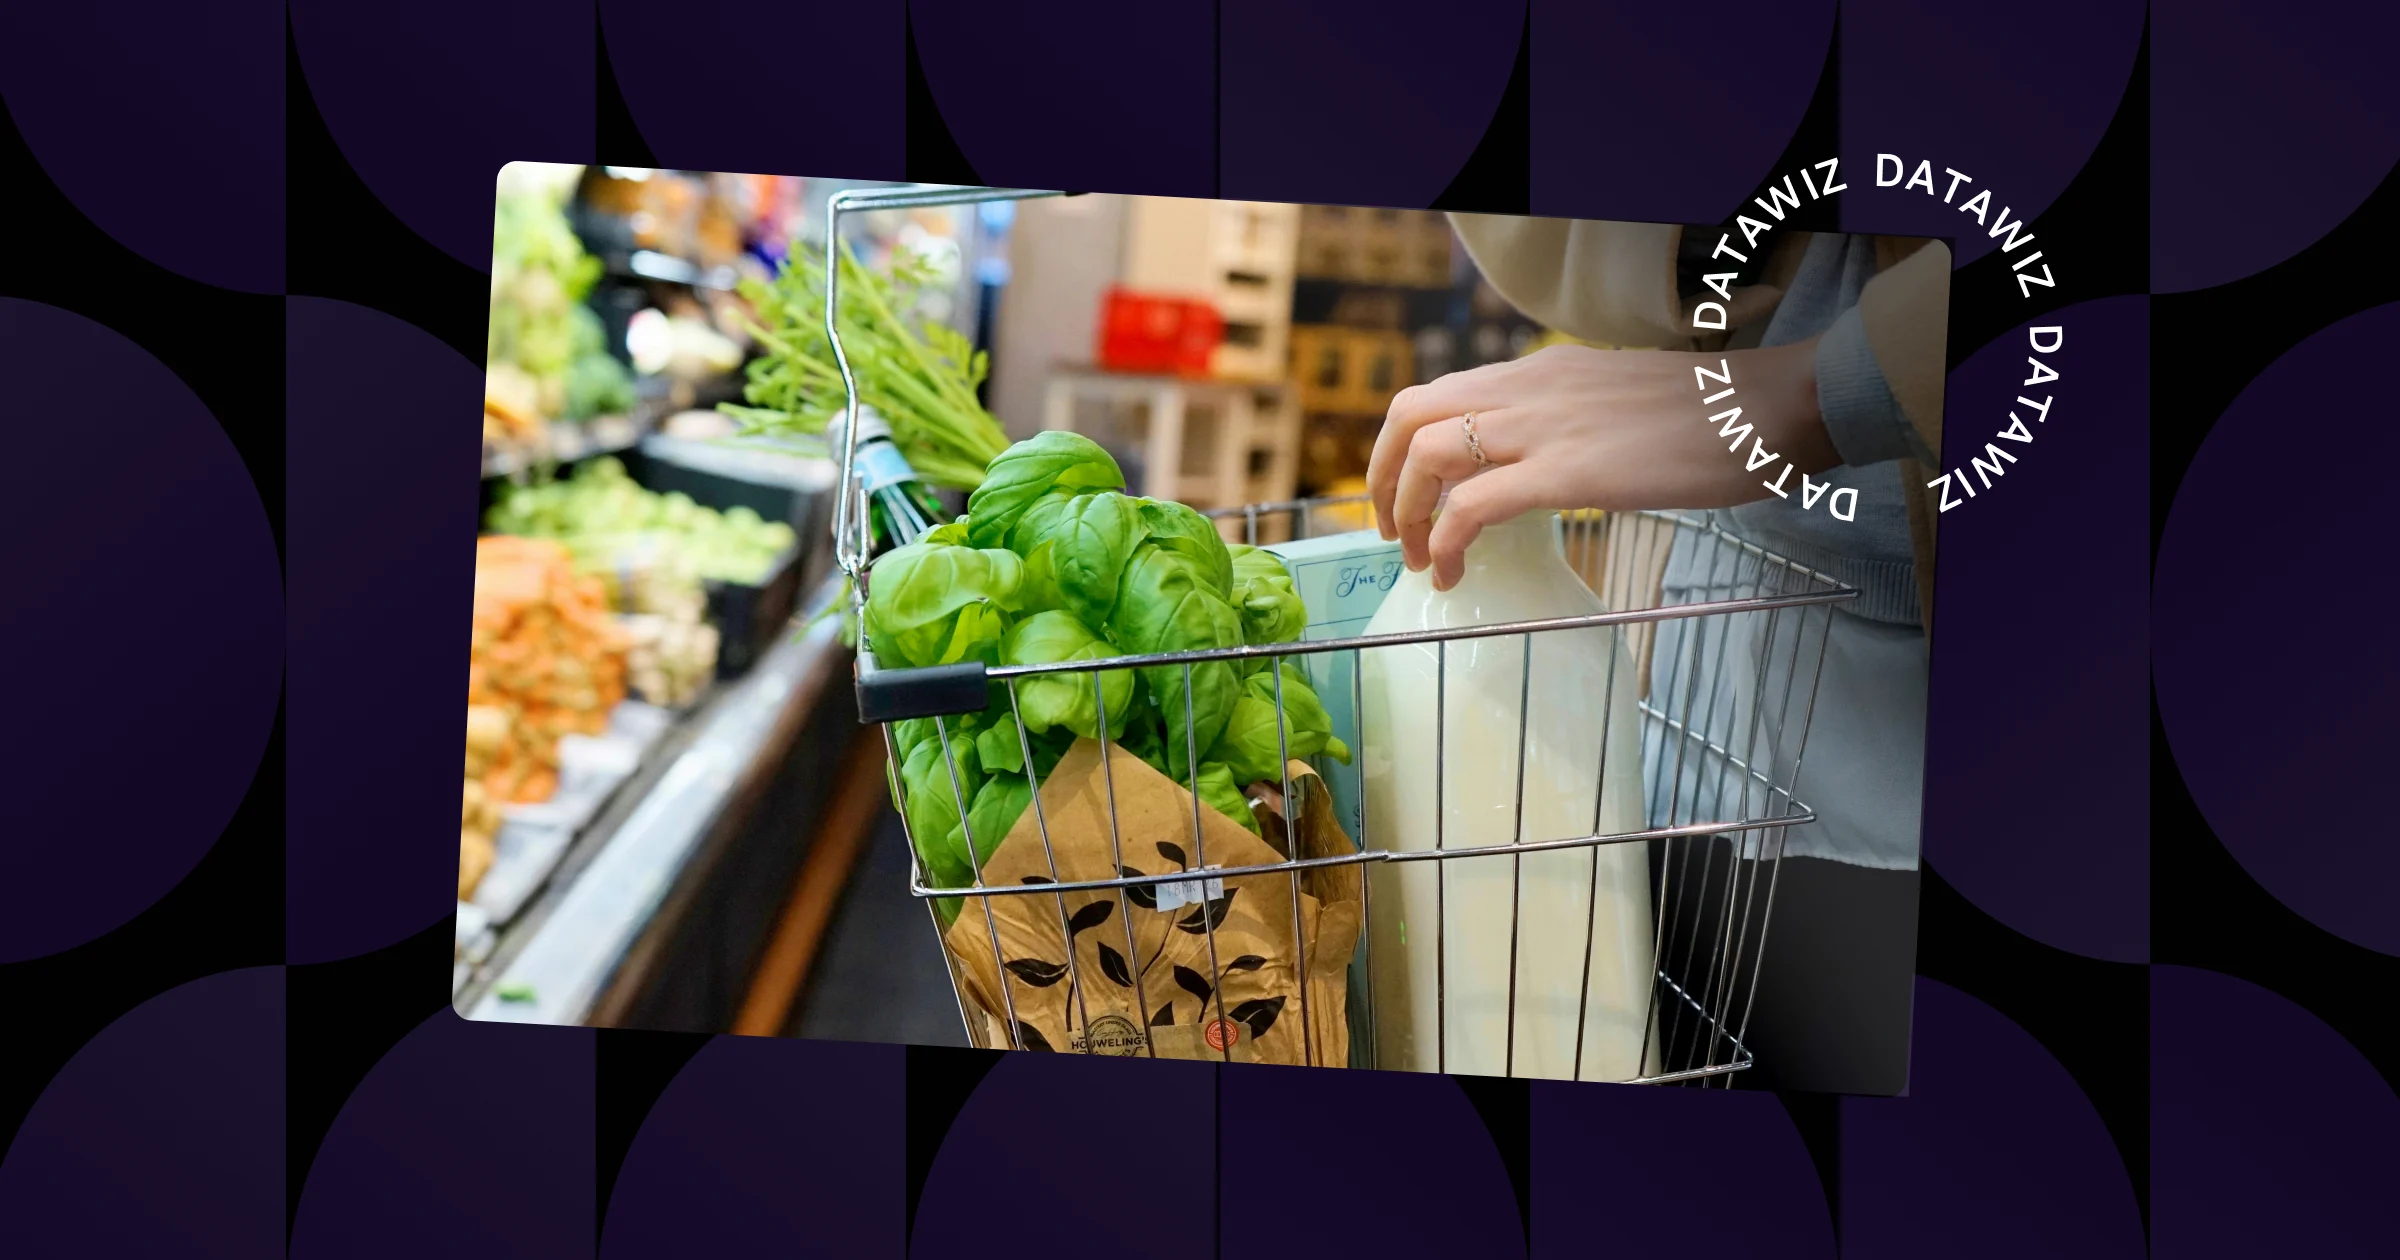
In retail, advanced analytics can take the form of demand forecasting based on historical sales, weather patterns, or even customer behavior. It can also uncover hidden patterns in basket structures, automatically determine the best product mix for each store, or optimize supply chain logistics.
From analysts to category managers, professionals use advanced data analytics not just to see the numbers, but to understand what they really mean. These tools provide actionable insights: which products are about to lose popularity, where out-of-stocks may occur, and how to redistribute inventory to maximize profit. It’s more than just an analysis tool — it’s a proactive mindset.
What are the benefits of advanced analytics?
Advanced analytics isn’t just a trendy tool — it’s a real asset in the daily operations of retail. It opens up a new level of understanding data and empowers businesses to act faster, with greater accuracy and confidence. Here’s what advanced analytics solutions can offer:
Accurate forecasting
Instead of “guessing” demand or relying solely on past performance, advanced analytics allows for high-precision forecasts of which products will be needed, when, where, and in what quantities. This helps retailers avoid both stockouts and overstocking, especially during seasonal peaks.
Faster decision-making
Algorithms process large volumes of data within seconds, significantly accelerating decisions — from promotion planning to auto-generating supplier orders. Managers receive ready-to-use recommendations that streamline internal operations and negotiations with suppliers.
Predictable outcomes
Advanced analytics helps replace intuition-based decisions with data-backed actions. With processed insights, it becomes clear what results to expect and what urgent actions to take. This is especially useful when budgeting, adjusting assortment strategies, or launching new stores.
Competitive advantage
Retailers who can see several steps ahead will always outperform those who react in the moment. Advanced analytics enables businesses to respond to market shifts quickly, adapt to trends, and align more precisely with customer expectations.
Optimized costs and resources
This is one of the most tangible yet often overlooked benefits. Data analytics helps companies plan purchases, logistics, staffing, and marketing budgets more effectively. The result? Less waste, higher profits, and smoother operations.
What are the methods of advanced analytics?
Advanced analytics includes a wide range of methods that help analyze past events, predict future trends, and automate decision-making. In retail, this is a key advantage for managing assortments, stock levels, marketing efforts, and even workforce planning.
- Predictive analytics
This method uses statistical models and machine learning algorithms to analyze historical data and forecast future events. In retail, this can mean predicting product demand, expected sales volumes, or the likelihood of changes in customer behavior. For example, the system might signal: “This product will stop selling in two weeks — consider adjusting your stock.”
- Diagnostic analytics
When something goes wrong, it’s crucial to understand why. Diagnostic analytics helps uncover the root causes of deviations — like a drop in sales for a specific category or rising stock levels. It digs deeper to identify the real source of the problem.
- Clustering
This technique groups objects (such as stores, products, or customers) based on similar characteristics. It enables more personalized approaches — from tailored promotions for customer groups to store-specific assortments and pricing. Clustering helps refine generic strategies into targeted ones.
- Time series analysis
This is essential in retail, as it tracks metric dynamics over time. It helps identify seasonality, trends, peaks, and demand declines. For instance, time series analysis reveals how ice cream sales shift with the seasons or how holiday demand patterns repeat annually.
- Data visualization
This is more than just nice-looking charts. It transforms complex data into clear visual signals. Well-designed visualizations quickly highlight problem areas, anomalies, or positive trends. Heatmaps and turnover graphs help decision-makers act within minutes, without digging through spreadsheets.
How is advanced analytics applied in practice?
In retail, advanced analytics is a powerful tool for making better decisions. Within the Datawiz system, these capabilities are already built into several reports that support the daily work of analysts and category managers.
Price Recommendations
The “Price Recommendations” report shows which products should have their prices adjusted, along with the projected impact on sales and profit. This report allows users to:
- identify products recommended for price updates in specific stores;
- visualize the relationship between price changes and profit;
- forecast sales performance based on the suggested pricing.
The algorithm uses price elasticity of demand — the correlation between price changes and sales volumes. Based on this, it calculates profit for different price points and identifies the optimal one.
Recommended Assortment
The “Recommended Assortment” report analyzes category and product sales across stores and suggests which items should be added to specific store assortments. It enables users to:
- detect products that are worth adding to particular stores;
- forecast potential sales of new items;
- optimize assortment strategy for higher profitability.
The system clusters stores based on demand similarity for certain categories. It then compares sales within each cluster to identify which products are missing in some stores but selling well in others — these become the recommended additions.
Lost Sales
The “Lost Sales ML” report uses machine learning to detect sales losses caused by stockouts or insufficient inventory. The system allows retailers to:
- identify lost sales by product, category, store, or manager;
- calculate the size of losses, including those from zero stock;
- visualize sales and inventory trends over time;
- detect operational issues and avoid future losses.
These reports go beyond just tracking performance — they enable proactive decisions grounded in data. Advanced analytics in Datawiz is a practical, everyday solution for driving smarter retail operations.

 ¡No se necesita tarjeta bancaria!